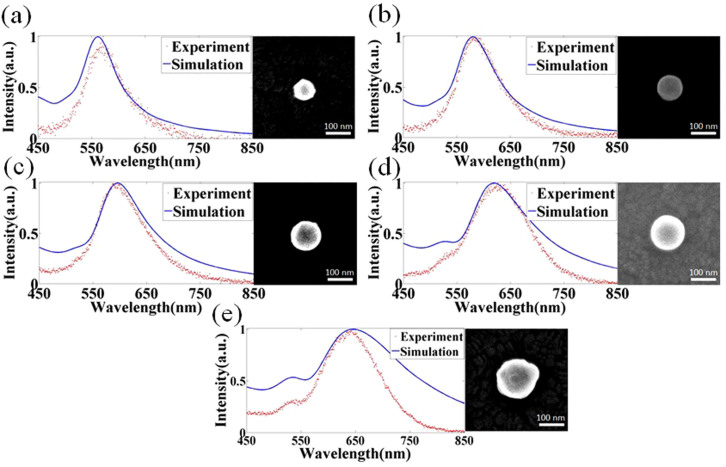
Figure 4. Measured (red dots) and simulated (blue lines) scattering spectra and corresponding SEM images of transferred NPs with different sizes.
The diameters are (a) 86 nm, (b) 115 nm, (c) 135 nm, (d) 148 nm and (e) 172 nm, respectively. A distinct red-shift can be observed as the NP size increases.

