Figure 1.

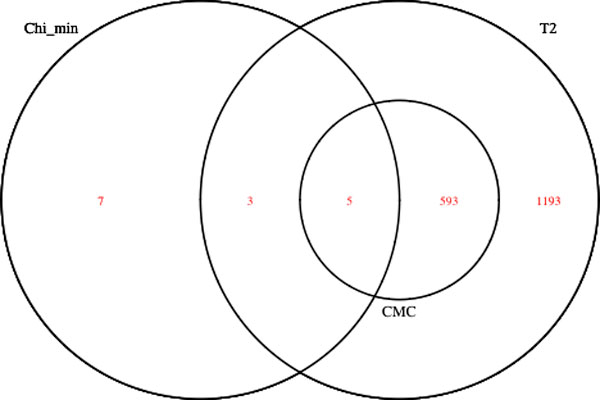
Venn diagram showing overlaps of the significant genes from Chi_min, CMC, and T2 at 4.7 × 10⁻⁶ level from the analysis all odd-numbered chromosomes of the real data set.

Venn diagram showing overlaps of the significant genes from Chi_min, CMC, and T2 at 4.7 × 10⁻⁶ level from the analysis all odd-numbered chromosomes of the real data set.