
Fig. 4.
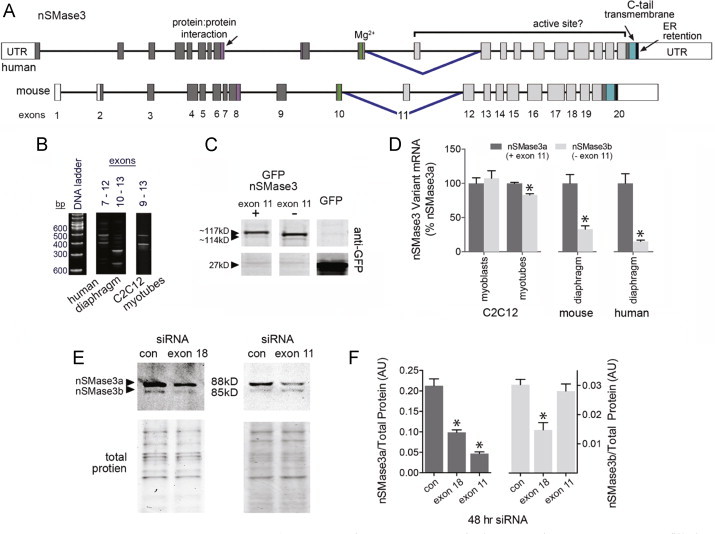
nSMase3 splice variant expression. (A) Structure of precursor mRNA for human and mouse nSMase3. Unfilled boxes represent untranslated regions (UTR); filled boxes are exons; lines are introns (scaled to 1/4 size relative to exons). Inverted blue carets indicate alternatively spliced exons. Below the maps are exon numbers. (B) Agarose gel shows human and myotube cDNA subjected to conventional PCR with primers that amplify select nSMase3 splice junctions (see Table 1). Numbers above the gels indicate the exon location for forward and reverse primers. Multiple bands indicate alternative splicing. (C) Western blot with anti-GFP shows expression of nSMase3 splice variant GFP-fusion clones. (D) Real-time PCR of nSMase3 splice variants. A forward primer in exon 11 and a reverse primer in exon 12 detects nSMase3a; a forward primer that spans the exon 10–exon 12 splice junction and a reverse primer in exon 12 detects nSMase3b (see Table 1; n=6 for human tissues, n=4 for mouse, n=3 for myoblasts or myotubes), ⁎P<0.05 vs. nSMase3a. (E) Western blot and total protein of extracts from siRNA treated myotubes, siRNAs (20 nM) targeted nSMase3a and b (exon 18) or nSMase3a (exon 11). siRNA primer sequences are listed in Table 1. (F) Quantification of E (n=9 control siRNA, n=6 exon 18 siRNA, n=3 exon 11 siRNA), ⁎P<0.05 vs. control.