
Fig 5.
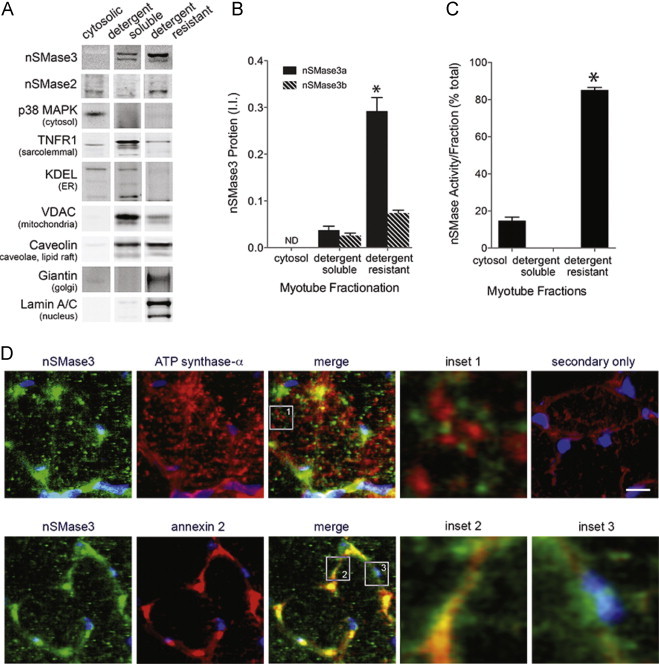
Distribution of nSMase3 in cellular fractions. (A) Western blot of myotube fractions. Antibodies to proteins that reside in discreet compartments show the composition of fractions. (B) Quantification of nSMase3 protein detected in A (n=6, ⁎P<0.0001 vs. detergent-soluble fraction and nSMase3b). (C) nSMase activity per fraction (choline release, n=3, ⁎P<0.0001 vs. cytosol). (D) Upper panel: immunofluorescent staining of mouse diaphragm sections with anti-nSMase3 (green) and anti-ATP synthase-α (red). Nuclei are stained with DAPI (blue). Inset 1 shows location relative to inner mitochondrial membrane. Lower panel: co-staining with nSMase3 (green) and annexin 2 (red) antibodies. Inset 2 shows nSMase3 staining near the plasma membrane, inset 3 shows perinuclear staining. Upper right panel, secondary antibodies only. Scale bar=10 µm.