
Fig. 8.
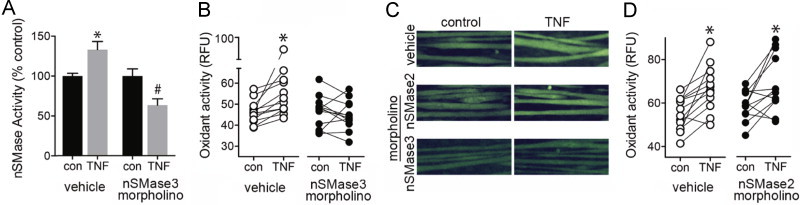
TNF, nSMase3, and oxidant signaling. (A) nSMase activity in myotubes transfected with vehicle (Endo-Porter) or nSMase3 morpholino (10 µM)±TNF (6 ng/ml, 15 min, n=6, choline release assay, P<0.0001 by ANOVA, ⁎ different from control, # different from TNF-treated vehicle, by Bonferroni’s multiple comparison). (B) Quantification oxidant activity from myotubes transfected with vehicle (Endo-Porter) or nSMase3 morpholino (10 µM)±TNF (6 ng/ml, 20 min). (C) Representative images of myotubes transfected with vehicle (Endo-Porter), nSMase2, or nSMase3 morpholino±TNF. (D) Quantification of oxidant activity from myotubes transfected with vehicle (Endo-Porter) or nSMase2 morpholino (10 µM)±TNF. Oxidant activity analysis was performed as in Fig. 7B.