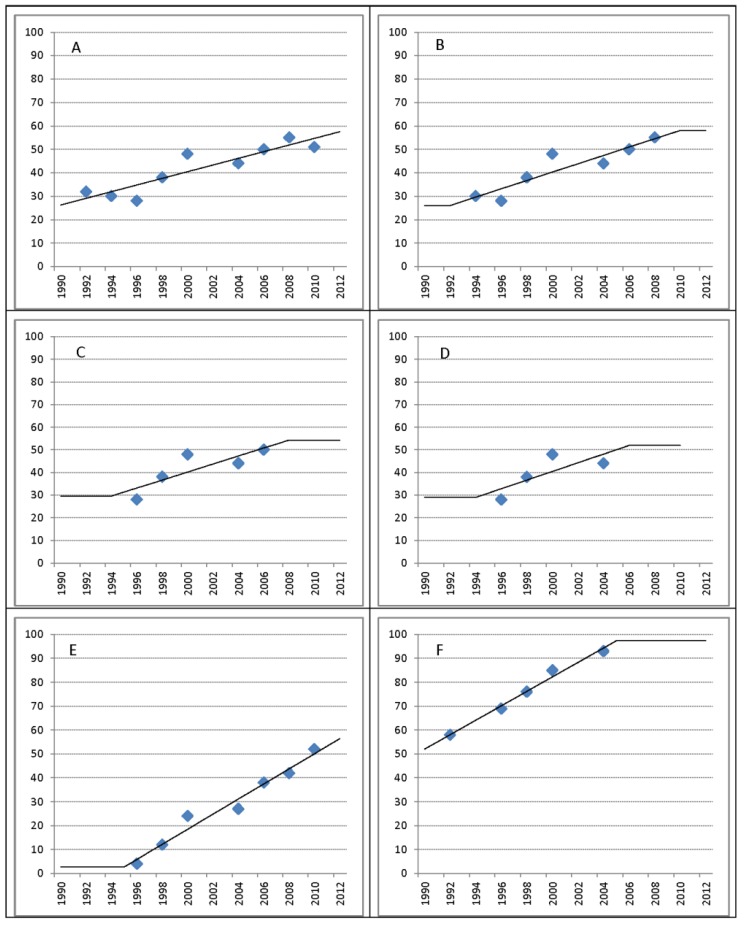
Figure 2.
Illustration of JMP regression line extrapolations for countries with missing data. (A) 9 data points (1992–2010); extrapolation 2 years; 1990 estimate: 26.3%; 2012 estimate: 57.6%. (B) 9 data points (1994–2008); Extrapolation 2 years + 2 years flat; 1990 estimate: 26.1%; 2012 estimate: 58.1%. (C) 5 data points (1996–2006); Extrapolation 2 years + 4 years flat; 1990 estimate: 29.6%; 2012 estimate: 54.3%. (D) 4 data points (1996–2004); Extrapolation 2 years + 4 years flat; 1990 estimate: 29.0%; 2012 estimate: Not available. (E) Flat below 5% coverage; (F) Flat after 95% coverage.

