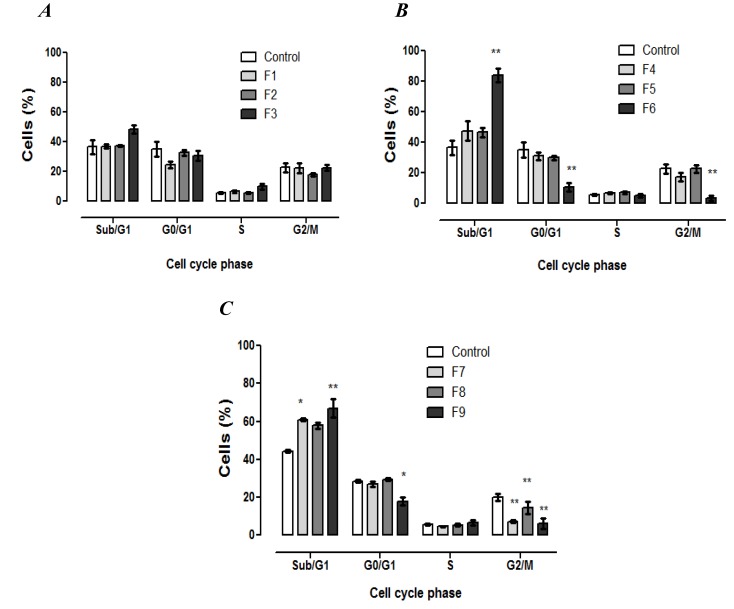
Figure 3.
Fibroblasts cell cycle analysis after 24 h of exposure to formulations. The percentage of cells in each phase of the cell cycle stained with PI solution (2 μg·mL−1) and analyzed by flow cytometry. (A) Formulations containing tripalmitin as matrix lipid; (B) formulations containing glycerol monostearate as matrix lipid; and (C) formulations containing stearic acid as matrix lipid. Data are expressed as mean ± SE of 3 independent experiments. ANOVA followed by Dunnett’s test (* p < 0.01, ** p < 0.001 against control).

