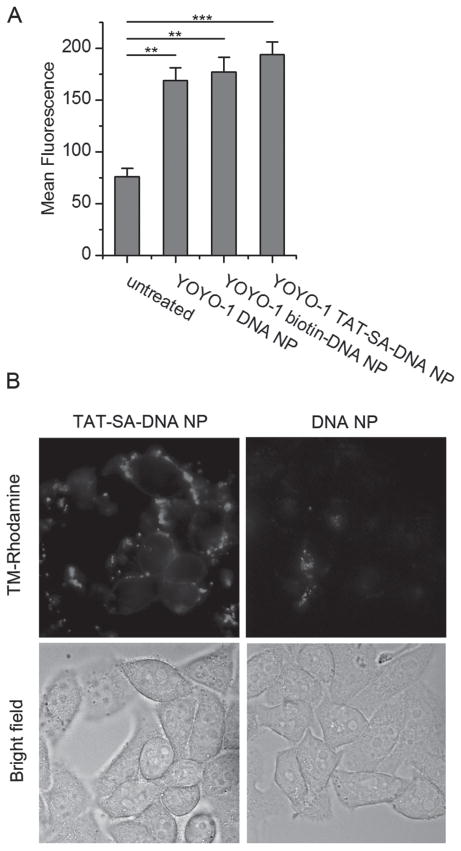
Figure 8.
(A) Cellular uptake of YOYO-1 labeled DNA NPs measured by flow cytometry. HeLa cells in 6 well plates were transfected with YOYO-1 labeled DNA NPs (20 μg/mL DNA) for 10 h. Results are shown as mean fluorescence of each sample with 10,000 events recorded (mean ± SD, n = 3). **P < 0.01; ***P < 0.001. (B) Cellular distribution of TM-Rhodamine labeled DNA NPs. HeLa cells grown in 35 mm glass-bottom dish were transfected with TM-Rhodamine labeled DNA NPs (10 μg/mL DNA) for 4 h. Cells were washed three times with 1×DPBS and images were acquired by a wide-field fluorescence microscope.

