Figure 2.

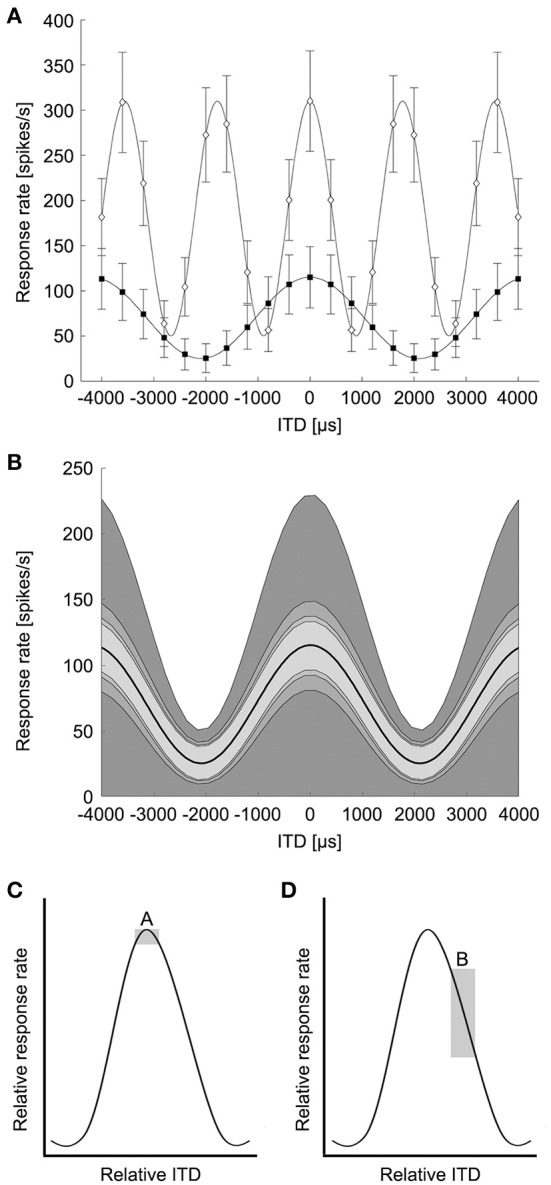
Modeling of ITD tuning in avian NL neurons. (A) Model neurons have sinusoidal ITD tuning curves with proportional Gaussian noise. A range of peak and trough firing rates were used at frequencies up to 4 kHz to model avian NL ITD tuning curves. White diamonds: 239 Hz, black squares: 562 Hz. Error bars are standard deviation (k = 2). (B) The variability of ITD responses was modeled as proportional Gaussian noise where the standard deviation of the spike count was given by the spike count raised to a power 1/k, k = 1, 2, 3, 4. The shaded regions indicate one standard deviation above and below the mean response (dark curve, 239 Hz). (C) Box A illustrates the possible difference in response rate (vertical dimension of box) if ITDs have to be discriminated around the peak of the ITD curve. (D) Box B illustrates the difference in response rate if the slope is used to discriminate between ITDs. (Adapted from Figure 6 in Hyson, 2005). The vertical dimension of box B is larger than box A, indicating a bigger change in response rate over the same ITD.
