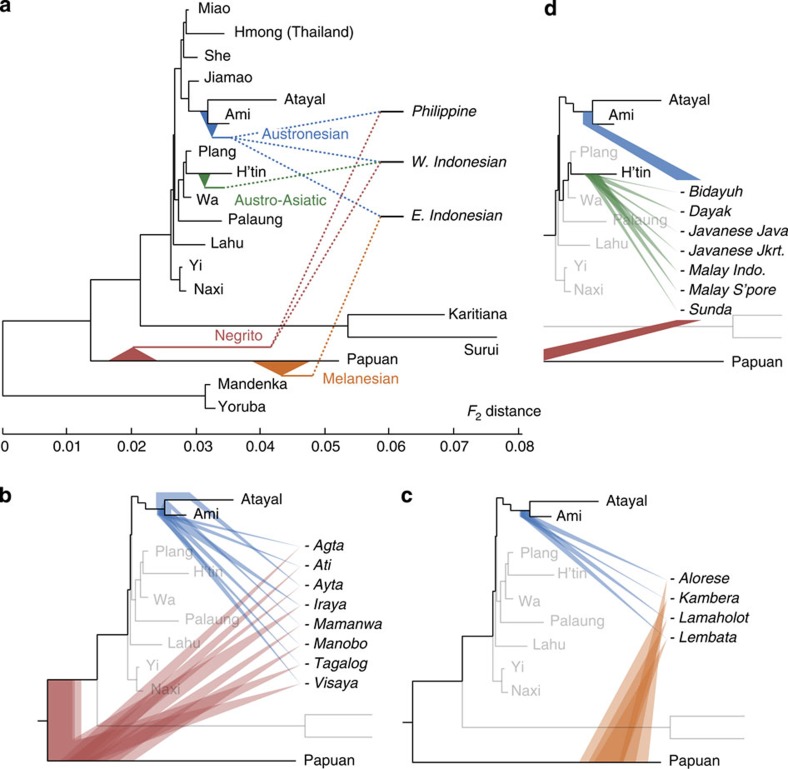
Figure 1. Inferred sources of ancestry for selected admixed Austronesian-speaking populations.
Shaded ranges represent 95% bootstrap confidence intervals for branching positions; see Supplementary Tables 10 and 11 for complete mixing branch distributions. The topology of the scaffold tree is shown using the full data set (slight variations are possible across bootstrap replicates). (a) Overview of the three best-fitting admixture models. (b–d) Detailed results for highest-confidence models of populations from (b) the Philippines, (c) eastern Indonesia and (d) western ISEA. In d, the Austronesian and Negrito branch positions are fixed in MixMapper to equal those for Manobo. Batak Toba are omitted for display purposes, as 8% of replicates place their third ancestry component on a non-adjacent branch in the scaffold (Supplementary Table 11). Three other populations (Manggarai Ngada, Manggarai Rampasasa and Toraja) fall into an additional category of three-way admixed eastern Indonesians, while Oceanians (Fiji and Polynesia) are inferred to have similar ancestry to the populations in c, but their confidence intervals are not directly comparable because they have fewer SNPs available (see Fig. 2 and Supplementary Tables 10 and 11).

