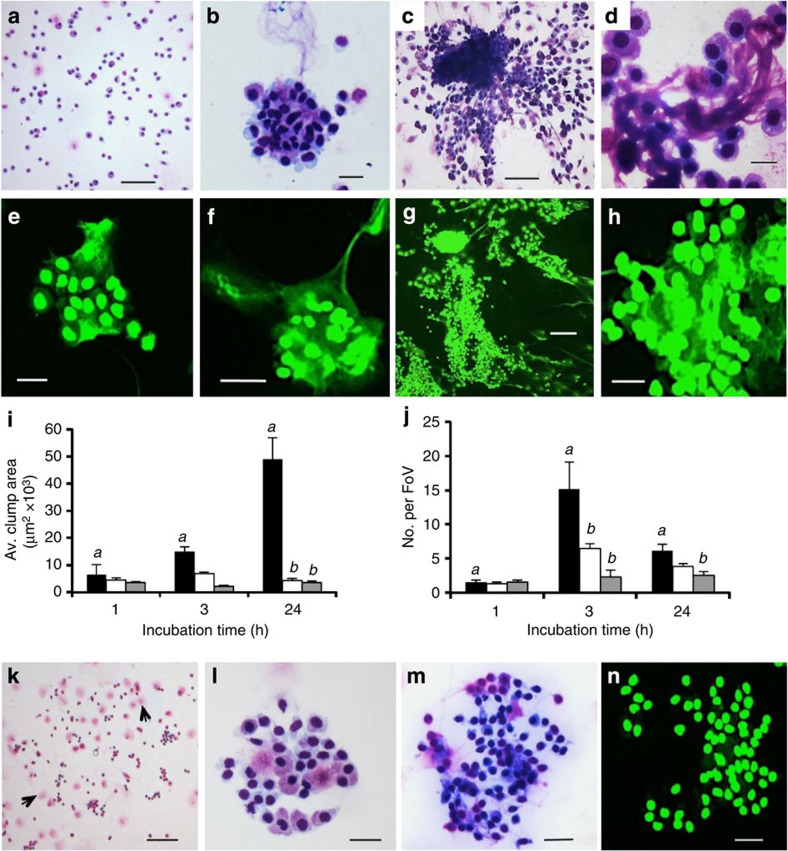
Figure 5. ETosis during the formation of haemocyte clumps in suspension culture.
(a–d) Diff-Quik stained cytocentrifuge preparations of unseparated C. maenas haemocytes. (a) 24 h, control (no PMA). Scale bar, 100 μm (b) 3 h, 0.1 μM PMA. Scale bar, 20 μm. (c) 24 h, 0.1 μM PMA. Scale bar, 100 μm. (d) Detail of clump (24 h) showing extruded material permeating intact cells. Scale bar, 20 μm. (e–h) Sytox Green stained cytocentrifuge preparations. (e) ETosis in small clump 1 h (0.1 μM PMA). (f) Clump showing intact haemocytes entrapped by extracellular chromatin (3 h 0.1 μM PMA). (g) 24 h, 0.1 μM PMA. Clump showing strands of chromatin. (h) Detail showing extracellular chromatin suffused through the cell matrix (24 h). Scale bars (e,f,h) 20 μm, (g) 100 μm. (i–n) Haemocyte clumps formed in PMA only, PMA+DPI or PMA+DNase. All incubations 10 °C. (i,j) solid columns=PMA only, open columns=PMA+DNAse-1, grey columns=PMA+DPI. Values are mean±s.e.m. of one representative experiment from three independent experiments. Significant differences between PMA-only treatments over time denoted by a. Significant differences between PMA-only and PMA+DNAse or PMA+DPI within one time point indicated by b, one-way analysis of variance with Student–Newman–Keuls post hoc test. (i) Clump size. Values are mean±s.e.m. (n=6–52). PMA 1 h versus 24 h, P<0.01; PMA 3 h versus 24 h and PMA versus PMA+DNAse-1, both P<0.001; PMA versus PMA+DPI P<0.05. (j) Number of haemocyte clumps (that is, >20 haemocytes in close contact). Values are mean number per field of view (FoV)±s.e.m. (n=6). PMA only 1 h versus 24 h, P<0.01. PMA only 1 h versus 3 h, and 3 h versus 24 h, both P<0.001. PMA versus PMA+DNAse, P<0.001; PMA versus PMA+DPI P<0.05. (k–m) Diff-Quik™ stained cytocentrifuge haemocyte preparations. (k) 24 h PMA+DPI. Compare with c. Arrows indicate degranulated cells. Scale bar, 200 μm. (l) Small, loose haemocyte clump, 3 h PMA+DNAse-1. Compare with b, f. Scale bar, 20 μm. (m) Haemocyte clump, 24 h PMA+DNAse-1. Compare with c,d. Scale bar, 40 μm. (n) Haemocyte clump, 24 h PMA+DNAse-1, Sytox Green stain. Compare with g,h. Scale bar, 20 μm.

