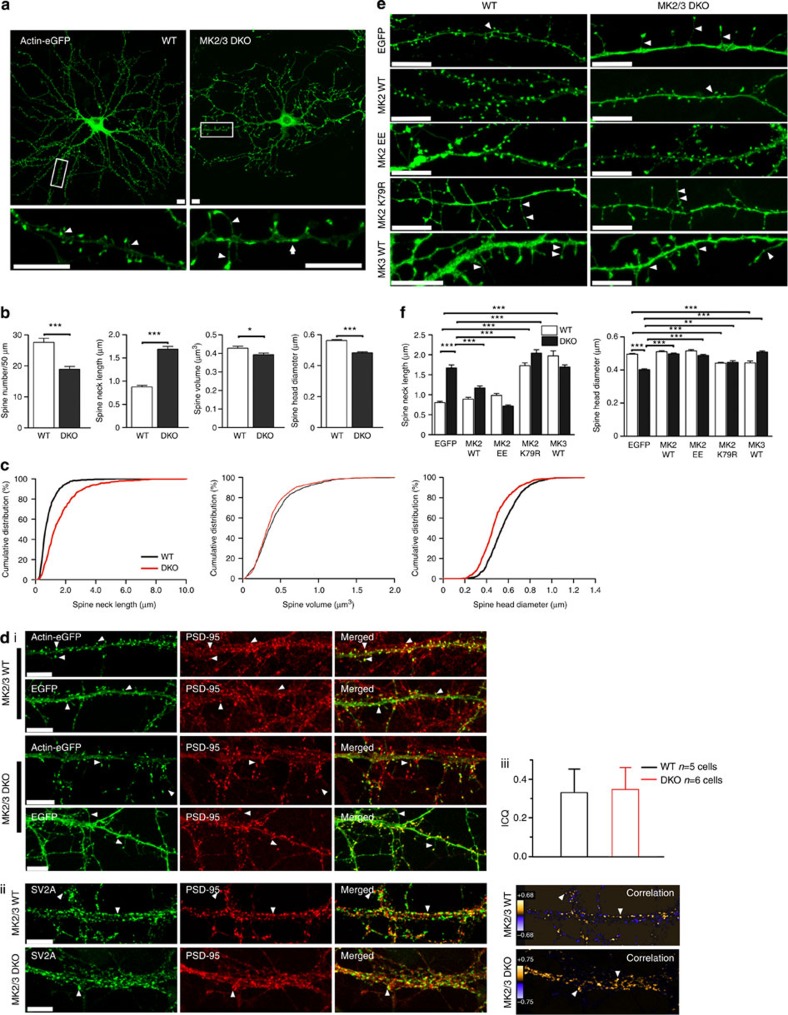
Figure 1. MK2 regulates spine morphology in hippocampal neurons.
(a) Images of cells expressing actin-EGFP. Note that actin accumulates at spine heads in WT cells, whereas in DKO cells actin accumulates along the process (arrows) and the spines display longer neck and smaller head diameters (arrowheads). (b) Graphs showing decreased spine density per 50 μm (WT: 27.6±1.34, 29 processes; DKO: 18.9±0.91; 28 processes), volume (μm3; WT: 0.43±0.01; 796 spines, 17 cells; DKO: 0.39±0.01; 801 spines, 23 cells), head diameter (μm; WT: 0.56±0.01; 796 spines, 17 cells; DKO: 0.48±0.01; 801 spines, 23 cells) but increased neck length (μm; WT: 0.88±0.03; 472 spines, 29 processes; DKO: 1.69±0.06; 464 spines, 28 processes). (c) Cumulative distribution of data shown in b. Note that the majority of the spines in DKO cells display longer necks compared with WT (***P<0.001), smaller spine head diameter (***P<0.001) and volume (**P<0.01). (d(i)) WT and DKO cells expressing EGFP or actin-EGFP co-stained with PSD95. Note the co-localization of the long and thin protrusions with PSD95 in DKO cells (arrowheads). (ii) Non-transfected cells co-stained with SV2a and PSD95. (iii) Co-localization analysis of pre- and postsynaptic marker. (e) WT and DKO neurons expressing a range of MK2- and MK3-EGFP-tagged constructs. (f) WT cells expressing MK2-K79R shows increased spine neck length (EGFP: 0.81±0.03, 412 spines; MK2-WT: 0.89±0.05, 189 spines; MK2-EE: 0.99±0.05, 385 spines; MK2-K79R: 1.73±0.07, 454 spines) and reduced head diameter (EGFP: 0.50±0.01, 629 spines; MK2-WT: 0.51±0.01, 672 spines; MK2-EE: 0.52±0.01, 564 spines; MK2-K79R: 0.44±0.01, 727 spines). Interestingly, spine neck length was reduced to WT levels in DKO cells expressing MK2-WT and MK2-EE, but not in cells expressing MK3-WT (EGFP: 1.67±0.08, 220 spines; MK2-WT: 1.17±0.05, 367 spines; MK2-EE: 0.72±0.03, 257 spines; MK2-K79R: 2.05±0.09, 296 spines; MK3-WT: 1.694±0.05, 700 spines), and head diameter was increased in DKO cells expressing MK2-WT, MK2-EE, MK2-K79R and MK3-WT (EGFP: 0.40±0.01 μm, 468 spines; MK2-WT: 0.50±0.01 μm, 909 spines; MK2-EE: 0.49±0.01 μm, 709 spines; MK2-K79R: 0.45±0.01 μm, 370 spines; MK3-WT: 0.509±0.01μm, 700 spines). An unpaired (Mann–Whitney) T-test (b), Kolmogorov–Smirnov (c) and one-way analysis of variance (d) with appropriate post-hoc test was used. Error bars=±s.e.m., *P<0.05, **P<0.01, ***P<0.001. Scale bar, 10 μm.

