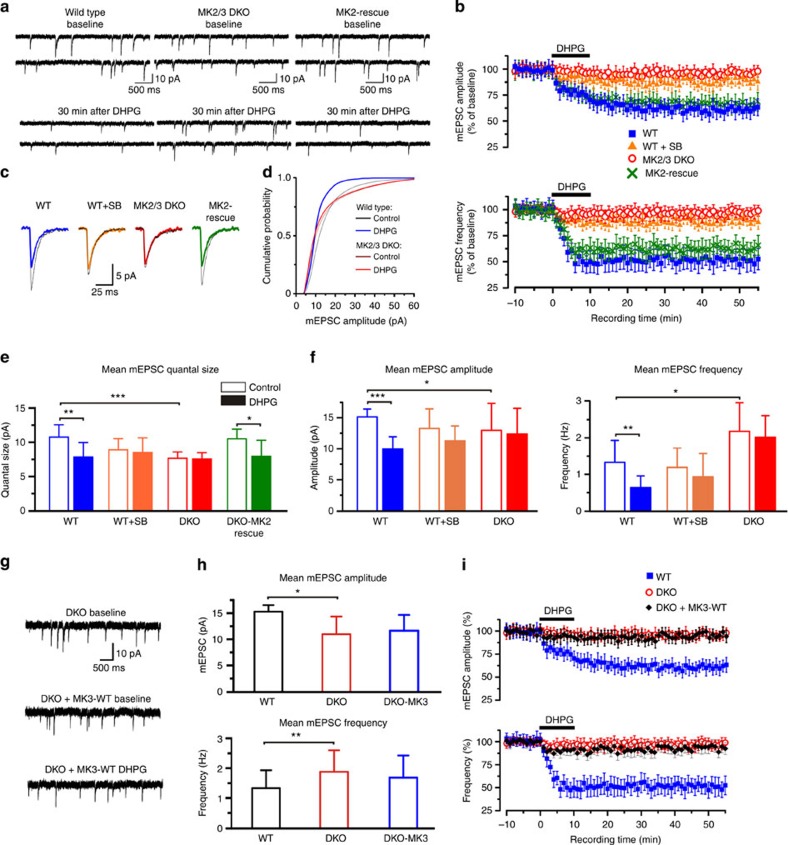
Figure 3. mGluR-LTD is impaired in MK2/3 DKO hippocampal neurons.
(a) AMPAR-dependent mEPSC traces from WT, DKO and DKO neurons expressing eGFP-tagged-MK2-WT (rescue) at baseline and 30 min after DHPG exposure. (b) Graphs showing average time course of changes in mEPSC amplitude and frequency. Average mEPSC amplitude was 60.6±7.4% of baseline at 45±5 min (blue trace; n=8) in WT, 87.9±6.3% in WT cells pre-incubated with the p38 inhibitor SB 203580 (5 μM; orange trace; n=7) and 95.7±7.2% (red trace; n=10) in DKO. Note that LTD was rescued in DKO expressing MK2-WT 66.5±7.7% (green trace; n=6). Average mEPSC frequency of WT cells was 51.9±8.9 of the baseline at 45±5 min following LTD induction (blue), compared with 88.3±5.8 in WT cells pre-incubated with p38 inhibitor (orange) and to 96.7±7.2 in DKO cells (red). Re-insertion of MK2-WT in DKO cells rescued the frequency (63.2±8.5% of baseline; green) to WT values. (c) Example of mEPSC waveforms recorded during baseline (black traces) and after DHPG exposure (coloured traces) for the cell recorded in a. (d) Cumulative mEPSC amplitude distributions from WT and DKO cells. (e) Graphs of mean mEPSC quantal size for all experimental conditions. Note that the DHPG-dependent reduction in activity observed in wild-type cells (blue bars) is occluded in DKO cells (red bars) but restored in DKO cells expressing MK2-WT protein. (f) Graphs showing that the DHPG-dependent reduction in frequency and amplitude observed in WT cells are impaired in DKO cells. (g) Representative mEPSC waveforms recorded from DKO; DKO cells expressing MK3-WT at baseline and 30 min after DHPG exposure. (h) Graph of mean mEPSC amplitude (DKO: 10.9±3.4 pA and DKO+MK3-WT: 11.7±3.5 pA) and frequency (DKO: 1.85±0.72 Hz and DKO+MK3-WT: 1.71±0.74 Hz) at baseline and (i) after DHPG exposure. Data shown are from DKO (n=14 cells); DKO cells expressing MK3-WT at baseline (n=6 cells) and after DHPG exposure (n=4 cells). Error bars=±s.e.m. Recordings were done in the presence of tetrodotoxin (1 μM), picrotoxin (50 μM) and L689–560 (5 μM). Error bars indicate the ±s.e.m. and *P<0.02, **P<0.01, ***P<0.005.

