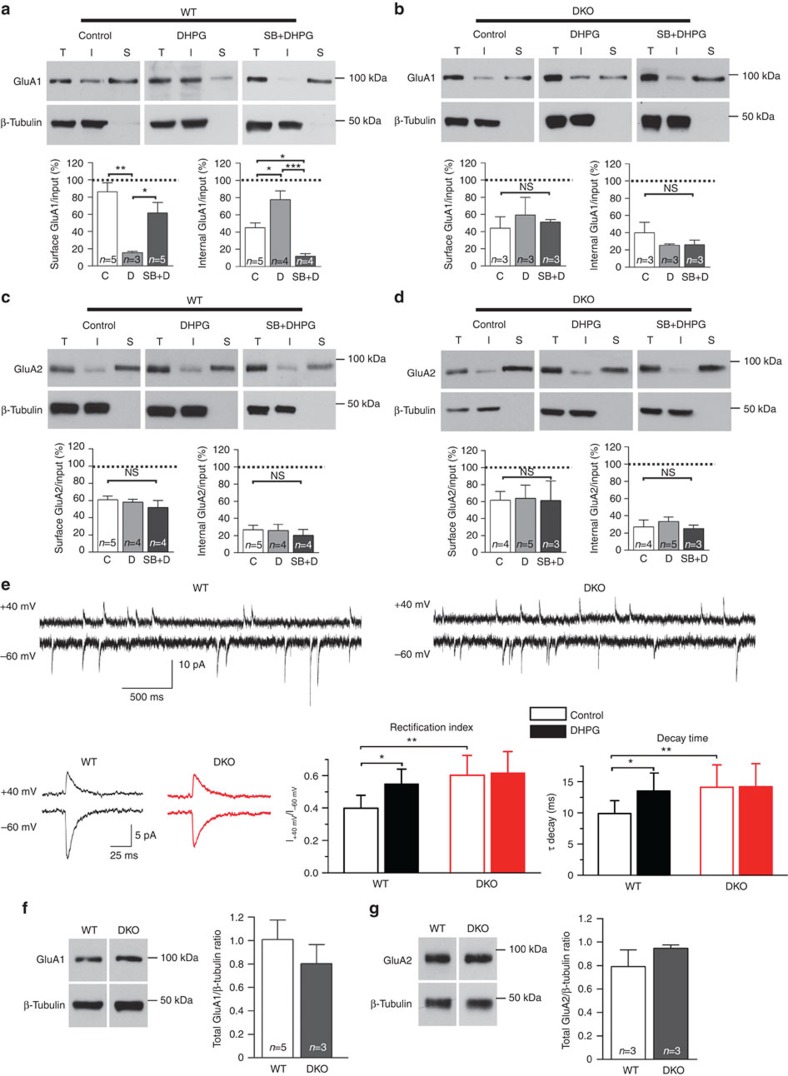
Figure 4. AMPAR trafficking is disrupted in MK2/3 DKO neurons.
(a) The amount of GluA1 at the surface (S) and internal (I) were analysed in WT hippocampal cultures in control (C), DHPG (D; 100 μM) stimulated and cells pre-incubated with SB 203580 (5 μM; SB+DHPG). Blot band analyses show significant decreases in surface GluA1 (control: 86.3±10.1%; DHPG: 15.5±1.4%; SB+DHPG: 61.3±12.4%) and significant increases in internal (I) GluA1 (control: 45.3±5.3%; DHPG: 77.6±10.1%; SB+DHPG: 11.8±3.3%) after DHPG application. Note that pre-incubation with SB prior DHPG exposure blocked the accumulation of internal GluA1. (b) GluA1 endocytosis is blocked in DKO cultures treated with DHPG. Blot analysis showing that DHPG exposure did not cause significant changes in the amount of GluA1 at the surface (control: 44.0±13.4%; DHPG: 56.2±20.8%; SB+DHPG: 51.2±2.7%) or in the amount of internal (I) GluA1 (control: 39.8±12.2%; DHPG: 25.4±1.5%; SB+DHPG: 26.0±5.1%). (c,d) Blot analysis showing that DHPG exposure did not cause any significant changes in the amount of GluA2 at the surface in WT (control: 60.93±4.3%; DHPG: 58.13±3.36%; SB+DHPG: 51.82±8.3%) or in DKO cells (control: 61.54±10.55%; DHPG: 63.96±15.43%; SB+DHPG: 61.20±22.91%). Data were obtained from at least three independent preparations. A one-way analysis of variance and appropriate post-hoc test was conducted. Error bars=±s.e.m. and *P<0.05, **P<0.01, ***P<0.001. (e) Representative mEPSC traces from WT and DKO neurons recorded at +40 mV and −60 mV holding potentials in the presence of spermine (100 μM) in the intracellular solution. Note the clear reduction in the peak amplitude and increase in decay time of the mEPSC waveform of DKO cell compared with WT held at −60 mV (average of events over 1 min). The rectification index and the constant decay were calculated by dividing the peak amplitude values and the decay time at +40 mV by −60 mV. For rectification index, WT (n=6 cells; control: 0.398±0.081, DHPG: 0.549±0.092) and DKO (n=5 cells; control: 0.602±0.123, DHPG: 0.618±0.132). For decay constant, WT (n=9 cells; control: 9.89±2.1, DHPG: 13.5±2.9) and DKO (n=10 cells; control: 14.1±3.6, DHPG: 14.2±3.7). Error bars indicate±s.d. and *P<0.05, **P<0.01. (f) Blot analysis showing GluA1 and GluA2 expression levels in WT and DKO cells. β-Tubulin was used as loading control. NS, not significant.

