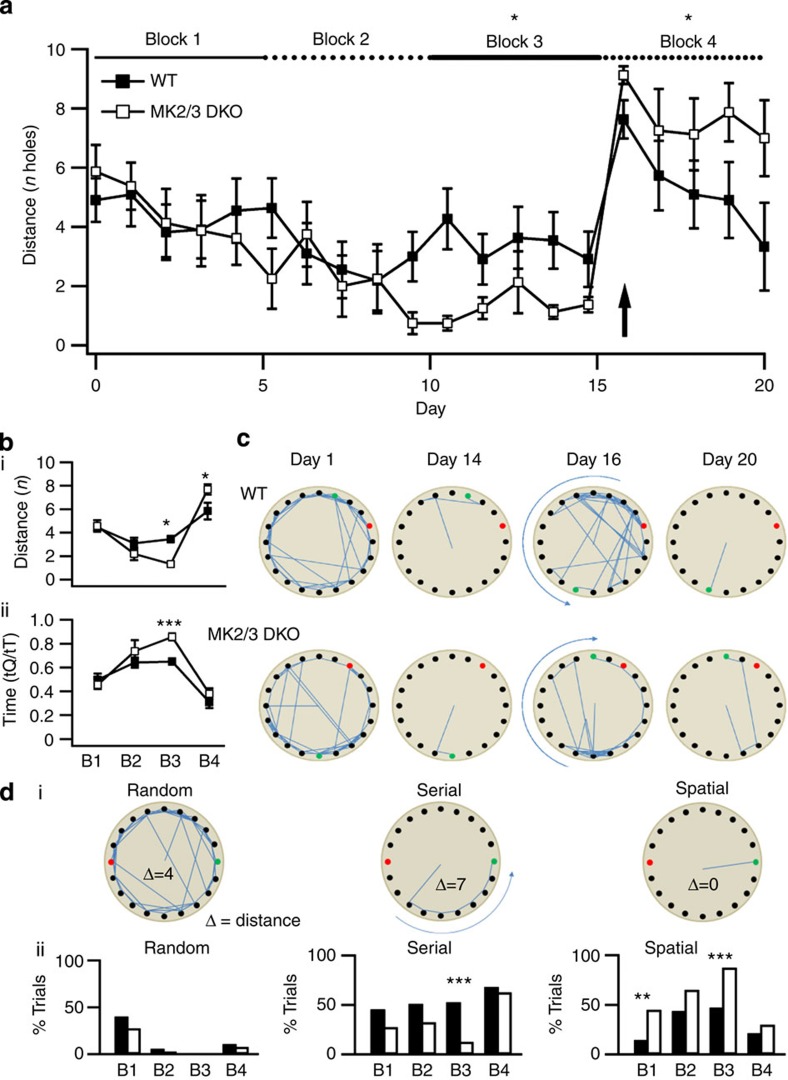
Figure 9. MK2/3 DKO mice have deficits in reversal learning.
(a) Daily average distance from the first hole visited and exit hole location (distance) for WT (n=11) and DKO (n=8) animals (F(7.364)=18.344; P<0.001, analysis of variance). By block 3, DKO animals showed a significant difference in spatial orientation compared with WT (mean distance from exit was 1.33±0.24 holes in DKO, 3.46±0.42 holes in WT). Following rotation of the exit hole by 180°, WT acquired the new orientation faster than DKO, who consistently returned to the original quadrant over block 4 (mean distance was 5.68±0.54 in WT; 7.68±0.49 in DKO). (b) Block averages for (i) distance and (ii) time spend in quadrant for WT and DKO. DKO animals showed a significant increase in time spent in the quadrant in block 3 (ratio of time was 0.46±0.04 in block 1, 0.86±0.03 in block 3, T-test). (c) Maps plotting hole visitation of an individual WT and DKO animal on day 1 (novelty), day 14 (task embedded), day 16 (180° rotation) and day 20 (final day). (d(i)) Maps showing example search strategies utilized by the animals and distance calculations (Δ), (d(ii)) Pooled data showing proportions of animals displaying random, serial or spatial search strategies in each block. DKO animals used significantly more spatial search strategies than WT in blocks 1 and 3 (45% of trials compared with 16% in WT in block 1, P=0.006 when compared with serial; 88% of trials when compared with 47% in WT in block 3, P<0.001 when compared with serial, Fisher’s-exact test), correlated to a significant drop in serial searches in block 3. Both groups used serial strategies on rotation of the exit hole. Error bars indicate ±s.e.m. and *P<0.05, **P<0.01, ***P<0.001.

