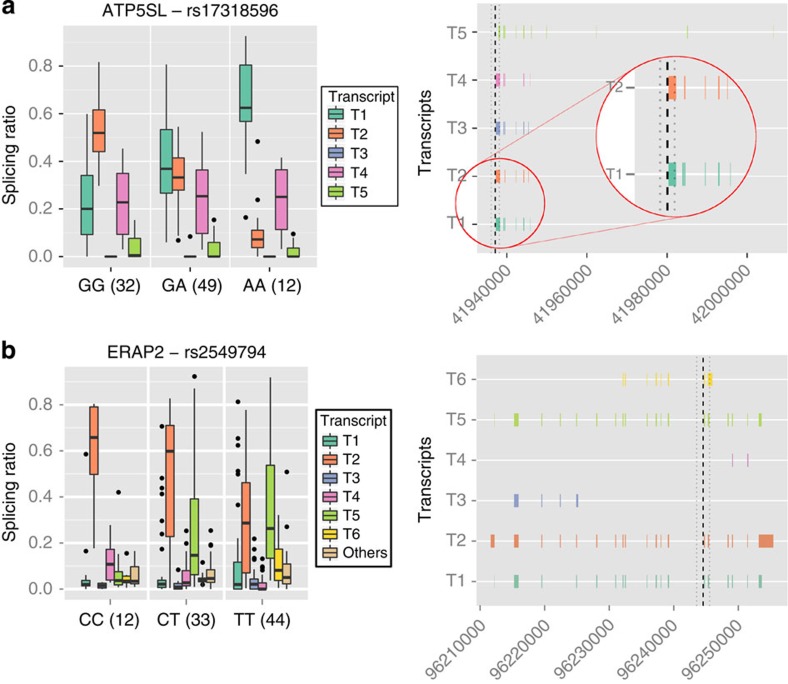
Figure 2. sQTL examples.
In the left panels, we represent as box-plots the distribution of the splicing ratios of the candidate gene in a selected population. The distributions are given separately for each genotype and the number of tested individuals in each genotype is given in parenthesis next to the genotype. Each splicing isoform is represented by a different color. When there are more than six transcripts, the lowly expressed ones are merged into a single one for clarity sake. The right panels show the exonic structure of the transcripts along with the location of the sQTL SNP (dotted line). (a) Association between the SNP rs17318596, and the ATP5S-like gene. In the left panel we represent as box-plots the distribution of the splicing ratios of this gene in the GBR population. The distributions are given separately for each genotype and the number of tested individuals in each genotype is given in parenthesis next to the genotype. Each splicing isoform is represented by a different color. The SNP rs17318596 has been found associated with height37, but no association with gene expression has been reported for it. We have detected, however, in the GBR and TSI populations, a strong effect of the SNP in relative abundance of the transcripts in this gene. The isoform T1 (green) is the dominant one in the individuals with the AA genotype, it captures on average 62% of the total expression of the gene while it captures only about 20% in the individuals with the GG genotype. Conversely, the isoform T2 (orange) captures more than 50% of the expression in the GG genotype but only about 5% in the AA genotype.The right panel shows the exonic structure of the transcripts along with the location of the sQTL SNP (dotted line). The isoform T2 skips the third exon compared with the isoform T1. (b) The endoplasmic reticulum aminopeptidase 2 gene, already known to host sQTLs17. We detected the SNP rs2549794, known to be associated to Crohn disease37, as a sQTL in CEU, FIN, TSI and YRI (displayed in the box-plot) populations.

