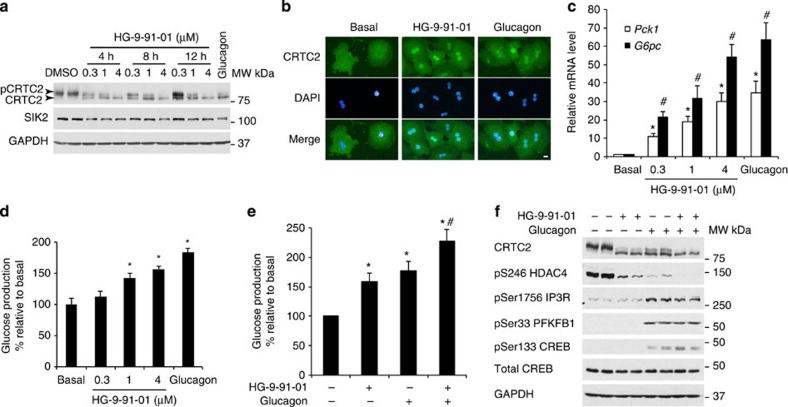
Figure 6. The SIK inhibitor HG-9-91-01 increases hepatic gluconeogenesis.
(a) Primary hepatocytes (8–12-week-old male C57BL/6) were treated with the indicated concentrations of HG-9-91-01 for 4, 8 or 12 h prior to cell lysis. Lysates were subjected to immunoblotting with the indicated antibodies. Primary hepatocytes were also treated with 0.1 μM glucagon for 12 h and included in the experiment as a positive control. (b) Primary hepatocytes were treated with 4 μM HG-9-91-01 for 1 h and 0.1 μM glucagon for 10 min. Subsequently cells were fixed with 3.7% paraformaldehyde and immunostained using a CRTC2 antibody and stained with 4′,6-diamidino-2-phenylindole (DAPI) for nuclear visualization. Images were captured with a fluorescence microscope (Nikon Eclipse Ti) using Nikon NIS-Elements BR 3.1 software. Scale bar is 10 μm in length. (c) Relative mRNA levels of Pck1 and G6pc were measured from primary hepatocytes using quantitative reverse transcription–PCR after an 8 h treatment with the indicated amount of HG-9-91-01 or 0.1 μM glucagon. The mRNA levels were presented as fold increase from non-treated hepatocytes (basal) and are presented as mean±s.d., n=3. *P<0.01 basal versus each treatment for Pck1 mRNA, # P<0.01 basal versus each treatment for G6pc mRNA. (d) Cell culture medium (12 h treatment) from the same experiment (c) was used to analyze glucose production. Glucose production was normalized to total cellular protein content and presented as percentage of glucose production by hepatocytes without treatment (basal). Glucagon treatment (0.1 μM) for 12 h was used as a positive control. Data is presented as mean±s.d., n=6. *P<0.01 basal versus 1 μM HG-9-91-01, 4 μM HG-9-91-01 or glucagon. (e) Glucose production was measured from primary hepatocytes that were treated with 4 μM HG-9-91-01 and/or 0.1 μM glucagon for 8 h. Glucose production was normalized to total protein content and presented as percentage of glucose production by hepatocytes without treatment (basal). Data is presented as mean±s.d., n=6. *P<0.01 basal versus HG-9-91-01 or glucagon, #P<0.05 HG-9-91-01 or glucagon versus HG-9-91-01 plus glucagon. (f) Primary hepatocytes were treated with 4 μM HG-9-91-01 for 8 h and/or 0.1 μM glucagon prior to cell lysis. Lysates were immunoblotted with the indicated antibodies.

