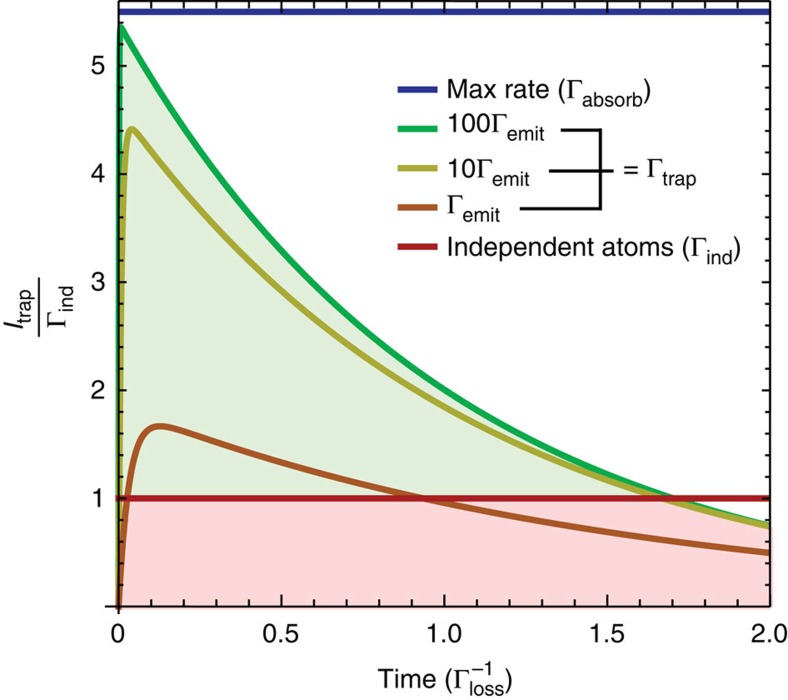
Figure 4. A superabsorption cycle.
Superabsorption of the effective two-level system indicated in Fig. 2. The green shading indicates the superabsorption region, the red when the extraction rate is below what could be extracted from uncorrelated atoms; both are for a system of 20 atoms and mode occupancy n(ωgood)=10. The maximum extraction possible from independent atoms (Γind=n(ωgood)Nγ) is used for comparison.

