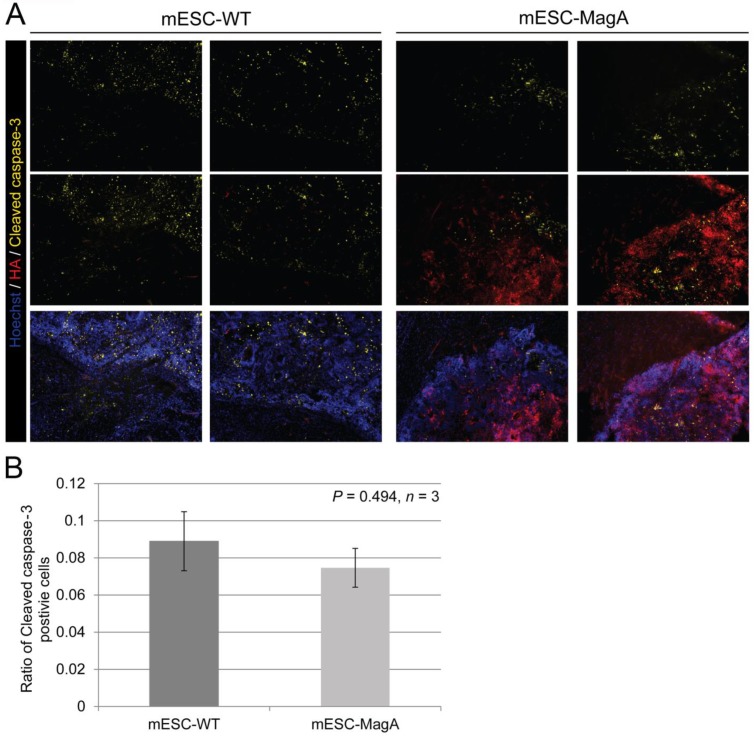
Figure 11.
Apoptotic cell population in tumor. (A) Representative pictures of mESC-WT- and mESC-MagA-derived tumor sections are shown. (B) Quantification of cleaved caspase-3-positive cell population demonstrated similar cleaved caspase-3-positive cell population for both mESC-WT-derived and mESC-MagA-derived tumor (P = 0.494, n =3). All histogram data are means ± SEM.

