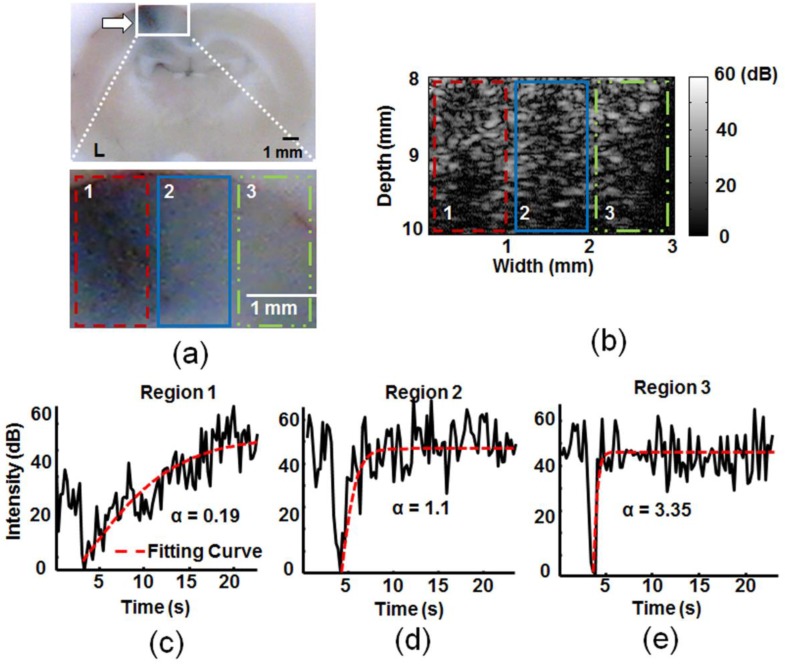
Figure 4.
Typical in vivo animal experiment to estimate the TIC response and corresponding kinetic parameter rate constant α distribution within the selected regions (1: Heavy BBB opening region at the FUS exposure center; 2: mild BBB opening region at the FUS exposure peripheral; 3: normal tissue without FUS exposure). (a) Upper: whole EB dye brain section; lower: 4× enlarged. (b) Corresponding B-mode images after MBs destruction (corresponding to the lower panel of (a)). (c) Corresponding TIC responses at the three selected regions and the estimated α values. Arrow: BBB-opening region.

