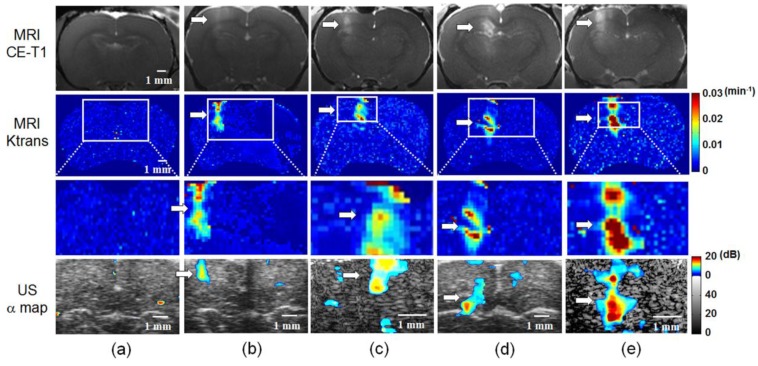
Figure 6.
Comparison of MRI-based detection (upper panels: CE-T1 MR images; 2nd and 3rd panels: MR Ktrans map, original and 2× / 4× enlarged) and rate constant α-change map (bottom panels; 2× / 4× enlarged) of FUS-induced BBB opening. (a) Control. (b) and (c) FUS exposure pressure of 0.5 MPa. (d) and (e) FUS exposure pressure of 0.7 MPa. Arrow: BBB-opening region.

