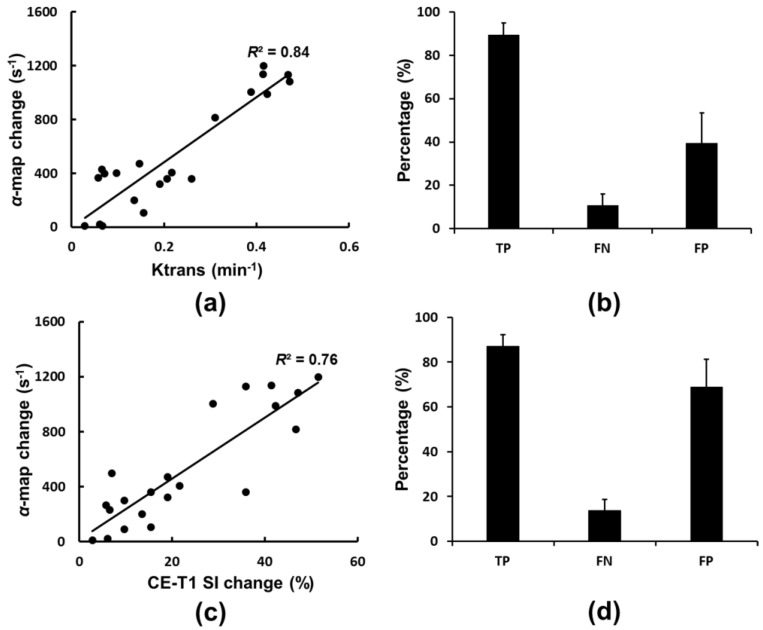
Figure 7.
(a) and (b) Correlation and the corresponding occurrence of true-positive (TP), false negative (FN), and false positive (FP) when comparing rate constant α-change map distribution to MR Ktrans map. (c) and (d) Correlation and the corresponding occurrence of TP, FN, and FP when comparing rate-constant α-change map distribution to CE-T1 MR images.

