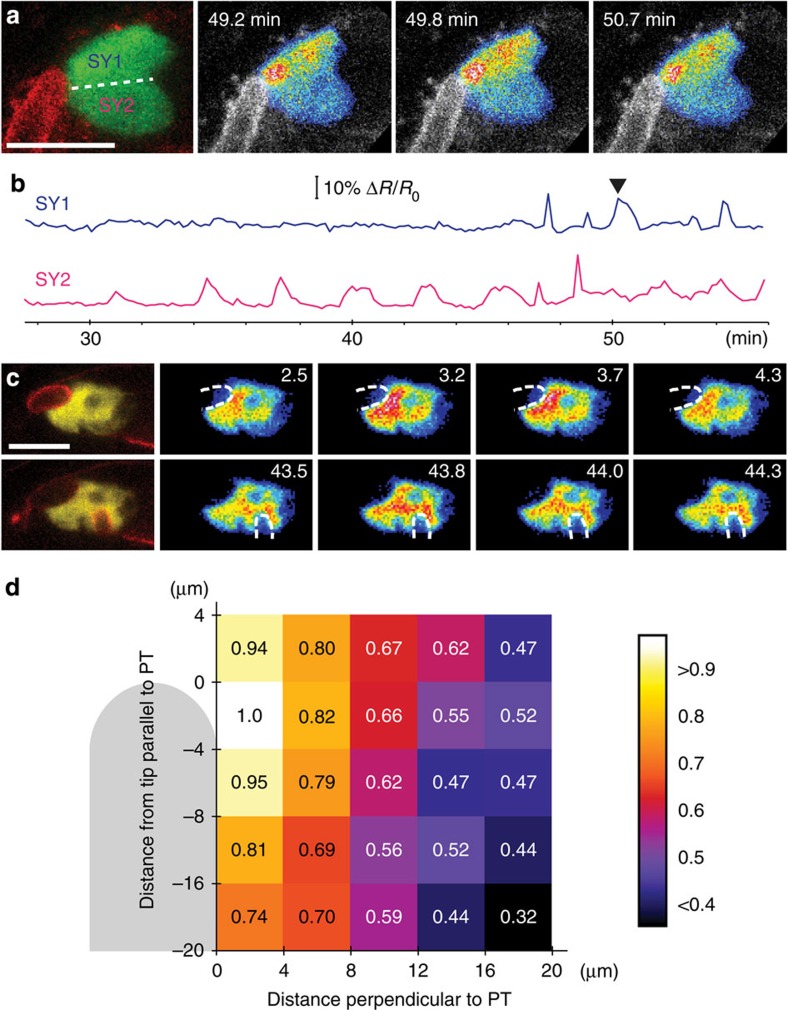
Figure 2. [Ca2+]cyto signature in the synergid cell depends on the physical interaction with the pollen tube apex.
(a) CerTN-L15 signals observed in each of the two SYs separately. Left panel: merged confocal image of a LHR PT tip (red) in contact with both pMYB98:CerTN-L15 expressing SYs (YFP signal of CerTN-L15 in green). Both SYs can be seen separately (SY1 and SY2). Right panels: one representative [Ca2+]cyto transient (beginning, maximum, end) occurring only in SY1, which is in contact with the PT. LHR pollen is shown in grey scale, ratio changes of CerTN-L15 in SYs are displayed as heat map. (b) Ratio changes recorded for both SYs. The ratio changes of CerTN-L15 were measured in the two SYs separately. Arrowhead marks the [Ca2+]cyto transient shown in a. (c) Local [Ca2+]cyto transients in relation to PT tip position. Two [Ca2+]cyto transients of one time series are shown. [Ca2+]cyto transients with LHR PT tip in contact with the filiform apparatus (upper row) and after being grown around the SYs (lower row). Left panel in both rows: merged confocal image of a LHR PT tip (red) in contact with pMYB98:CerTN-L15 SYs (YFP signal of CerTN-L15 in yellow). Right panels of both rows: time points of corresponding time series before, during and after a transient of [Ca2+]cyto in the SYs (ratio of CerTN-L15 displayed in pseudo colour). The maximum of the [Ca2+]cyto is different in both rows and correlates with the position of the PT tip (dotted line indicates the position of the PT according to the signal shown in the left panel). (d) Mapping of amplitudes of [Ca2+]cyto transients in relation to the distance to PT tip. Schematic of a PT tip in contact with a SY. Amplitudes of [Ca2+]cyto elevations were measured in 44 mm regions (indicated as squares) over the SY in time series registered to the PT tip. Measured amplitudes of the maximum number of detected [Ca2+]cyto transients in five independent experiments. Numbers in each square display the normalized average amplitude height. For statistical data, see Supplementary Fig. 2b. Scale bars, 20 μm.

