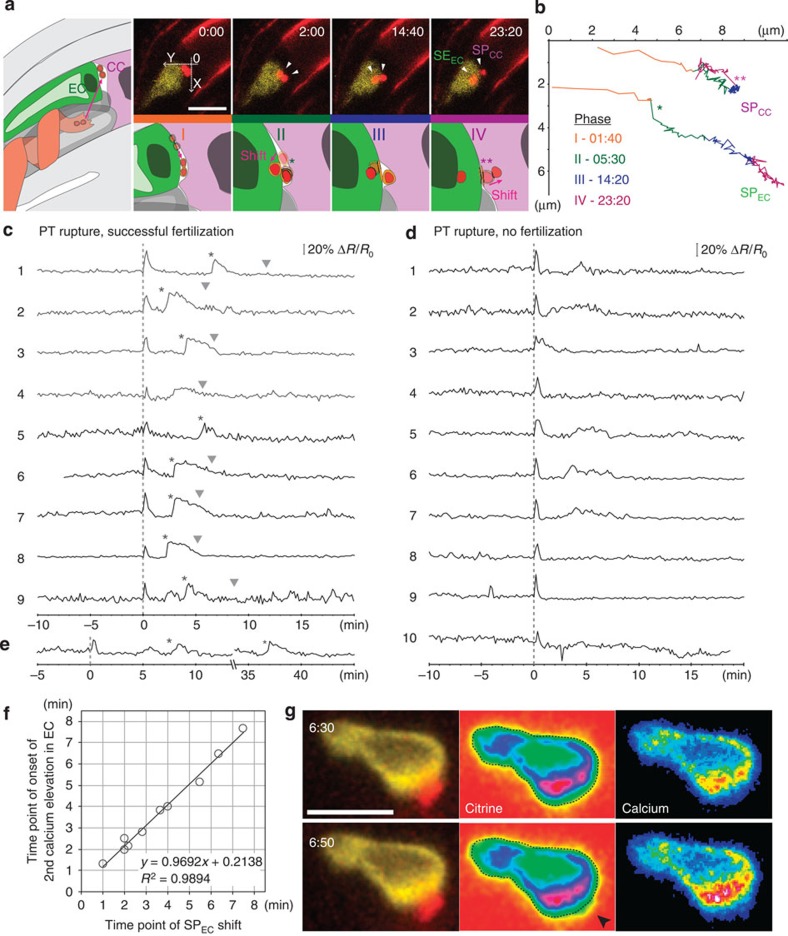
Figure 4. A second [Ca2+]cyto transient in egg cells is associated with successful fertilization.
(a) Left: scheme depicting SP release from a PT growing around receptive SY (drawn in grey). After burst, SPs are located at the fusion site between EC and CC. Upper panel: time series of LHR SP (red, arrowheads) fertilizing an egg cell expressing the CerTN-L15 sensor (yellow). In the left micrograph, zero and orientation of the coordinate system in b are indicated. Lower panel: scheme of different phases of sperm cell movement before and during fusion. Phase I: parallel movement of sperm cells after arrival along fusion site. Phase II: sideward shift of SPEC (single asterisk) towards EC. Phase III: arrest of SPCC and movement of SPEC nucleus towards EC nucleus. Phase IV: sideward shift of SPCC (double asterisk) and subsequent fast sperm nuclei separation. (b) Tracking movement of both sperm cells at fusion site of experiment shown in a. Different colours of the tracks indicate the four different phases and numbers indicate end points of each phase after sperm delivery in minutes. Shift of SPEC occurs at 1:40 min (single asterisk) and shift of SPCC at 14:20 min (double asterisk) in this example. (c) [Ca2+]cyto signals in the EC during successful fertilization. Graphs are normalized and aligned to time of PT rupture (0.0 min). Asterisks mark shift of SPEC, arrowheads mark fast separation of both sperm nuclei indicating successful fertilization of both female gametes. In traces 4 and 5, SPs were not visible at all times. In all cases, two Ca2+ transients occur: a short single transient during PT rupture and a longer extended transient after SPEC shift (Phase II). (d) Variety of [Ca2+]cyto signals in the EC during unsuccessful fertilization. Only a single Ca2+ transient occurs on pollen tube rupture (0.0 min). (e) Exceptional case of EC fertilization. Ratio change of pEC1:CerTN-L15 is shown. SPEC displays two shifts (asterisk) before fusing with the EC. Each shift is followed by a Ca2+ transient in the EC (Corresponding kymograph see Supplementary Fig. 4d). (f) Correlation of SPEC shift towards EC and beginning of second Ca2+ transient in EC (n=10). Formula of linear regression and calculated coefficient of determination (R2) are given. (g) Diffusion of sensor molecules into sperm cells upon gamete fusion. Time points before (top row) and after SPEC shift (bottom row). Left column, fluorescent micrographs of egg cell (yellow, citrine signal of CerTN-L15) and LHR sperm cell nuclei (red). Middle column, false colour representation of egg cell citrine signal. The dotted line displays the egg cell outline before the SPEC shift. The arrowhead indicates spreading of citrine signal towards the position of sperm cells. Scale bars, 20 μm.

