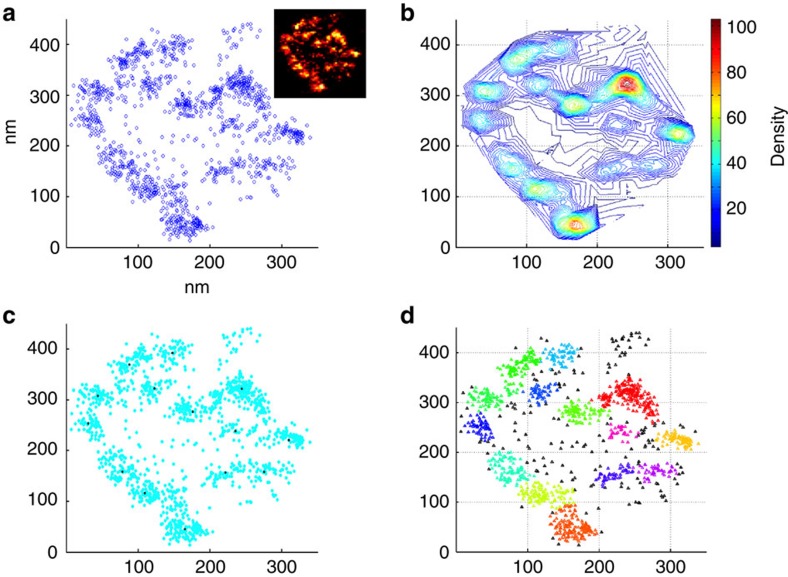
Figure 2. Density-based analysis reveals that CAZ-units are built from multiple Brp clusters.
(a) Spatial distribution of localizations in a specific CAZ-unit (shown as inset). (b) Density distribution of localizations in a 20-nm search radius (number of localizations within Eps-environment colour coded). Difference between elevation lines, 2 nm. (c) Centres of mass, that is, local density maxima as discovered by algorithm. (d) Final clusters as defined by algorithm. Each colour represents a different cluster. Parameters used for algorithm: 20 nm search radius (Eps) and 16 neighbours threshold (k).

