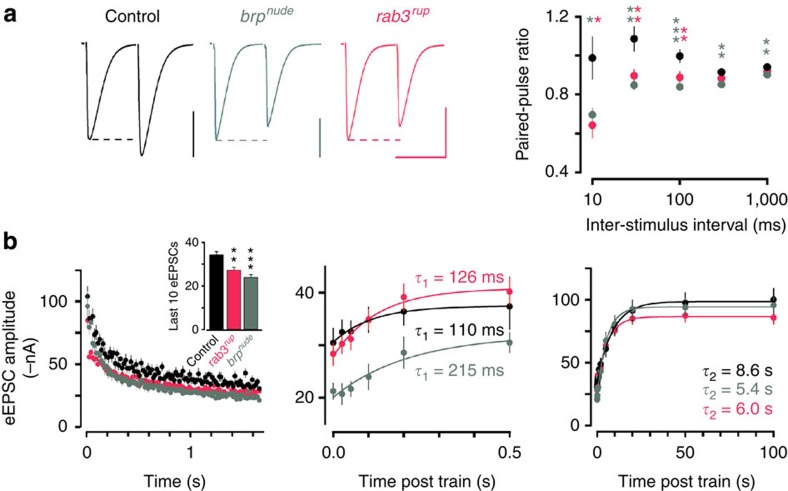
Figure 5. Electrophysiological characterization of different AZ states.
(a) Representative traces (normalized amplitude of the first eEPSC) and average data of two-electrode voltage clamp recordings from larval NMJs show similar depression of brpnude (grey) and rab3rup (pink) eEPSCs during paired-pulse stimulation (rank sum test versus controls: brpnude for 10 ms P=0.014, for all other intervals P≤0.01; rab3rup for 10 ms P=0.016, for 30 and 100 ms P≤0.01) and (b) 60 Hz trains (eEPSC 91–100 mean; control: −34.3±1.5 nA s.e.m., n=10 NMJs; brpnude: −23.9±1.3 nA, n=10, rank sum test P<0.001 versus control; rab3rup: −27.3±1.4 nA, n=11, P=0.004 versus control). The fast phase of recovery after stimulation is selectively slowed in brpnude (centre panel), while all three genotypes show a normal slow recovery phase (right). Scale bars, (a) 30 nA, 30 ms. Data are presented as mean±s.e.m.

