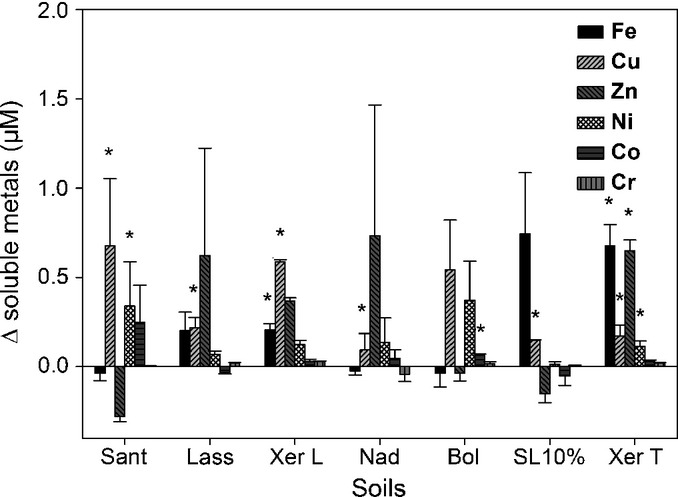
Fig. 3.

Differences (Δ) in soluble metal concentrations between the sampled bulk and rhizosphere soil solution calculated by subtracting metal rhizosphere from average bulk soil concentrations, averaged across both sampling events. Values represent means ± SE (n = 6). Statistically significant differences are highlighted: *, P < 0.05. Sant, Santomera; Xer T, Xeraco topsoil; Xer L, Xeraco subsoil; Bol, Bologna; Nad, Nadec; Lass, Lassee; SL 10%, Siebenlinden + 10% CaCO3.
