
FIGURE 2.
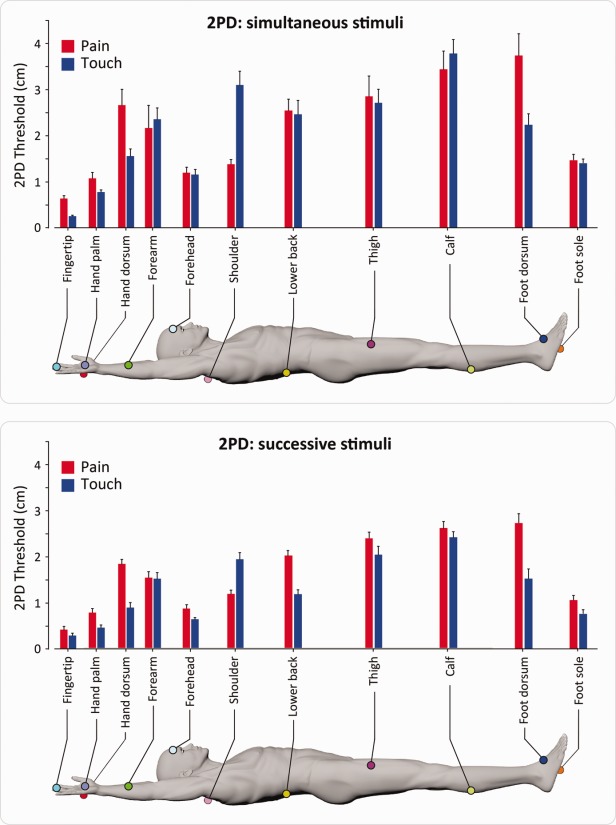
Mean 2-point discrimination (2PD) thresholds for pain and touch across the body surface. Thresholds were measured in 2 separate groups of participants, using either simultaneous stimuli (top panel, n = 16) or successive stimuli (bottom panel, n = 10). Error bars express variability (standard error) across participants. [Color figure can be viewed in the online issue, which is available at www.annalsofneurology.org.]