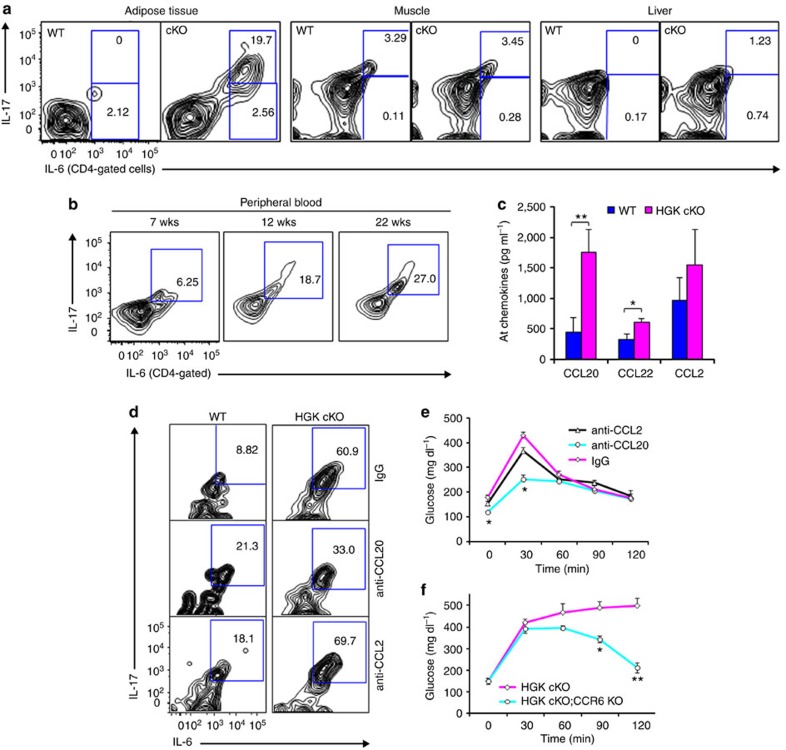
Figure 6. Accumulation of IL-6/IL-17 double-positive T cells in adipose tissue mediated by CCL20-CCR6 interactions.
(a) Cells were isolated from adipose tissue of 8-week-old WT or T-HGK cKO mice. Cells (without stimulation) were stained for expression of IL-6, IL-17, CD3, CD4 or CD45, and then cells were analysed by flow cytometry. Representative contour plots show percentages of IL-6- and IL-17-producing, non-stimulated CD4+ T cells in the insulin-targeted tissues. (b) The peripheral blood of T-HGK cKO mice at indicated ages were isolated, stained for IL-6+ and IL-17+ CD4+ T cells and analysed by flow cytometry. wks, weeks. (c) The levels of indicated chemokines from adipose tissue (AT) of WT or T-HGK cKO mice were determined by ELISA assays. (d) Cells were isolated from adipose tissue of mice at day 2 after CCL20 or CCL2 neutralization. Cells (without stimulation) were stained for expression of IL-6, IL-17, CD4 or CD45, and then cells were analysed by flow cytometry. (e) GTT tests were performed on T-HGK cKO mice at day 2 after CCL2 or CCL20 neutralization. Glucose levels were plotted versus time post glucose injection. n=5 per group. (f) GTT tests were performed on 18-week-old T-HGK cKO (CD4-Cre;HGKf/f) mice (n=6) and CCR6 KO/T-HGK cKO (CD4-Cre;HGKf/f;CCR6−/−) mice (n=5). Glucose levels were plotted versus time post glucose injection. Means±s.e.m. are shown. Glucose levels were plotted versus time. Data shown are representatives of three (a,d) and two (c,b,e,f) independent experiments. Means±s.e.m. are shown. *P-value<0.05; **P-value<0.01 (two-tailed Mann–Whitney U-test).

