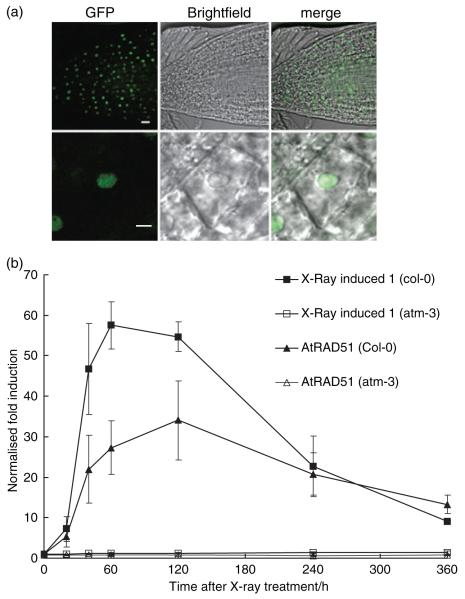
Figure 2.
Expression of X-RAY INDUCED 1.
(a) Subcellular localization of an smrs–GFP–XRI1 fusion protein analysed by laser scanning confocal microscopy. Nuclear localization of XRI1 was observed in the root tip and at higher magnification in a root cell. Scale bar = 5 μm.
(b) Real-time RT-PCR analysis of XRI1 and AtRAD51 expression after 10 Gy X-ray irradiation. Fold induction of XRI1 (■) and AtRAD51 (▲) transcripts was measured at 1 h time points in wild-type (closed squares/triangles) and atm-3 (open squares/triangles) following X-ray treatment. The transcript levels were normalized against the ACTIN2 transcript levels in each sample. Error bars represent the standard error of the mean of three biological replicates.

