Figure 1.
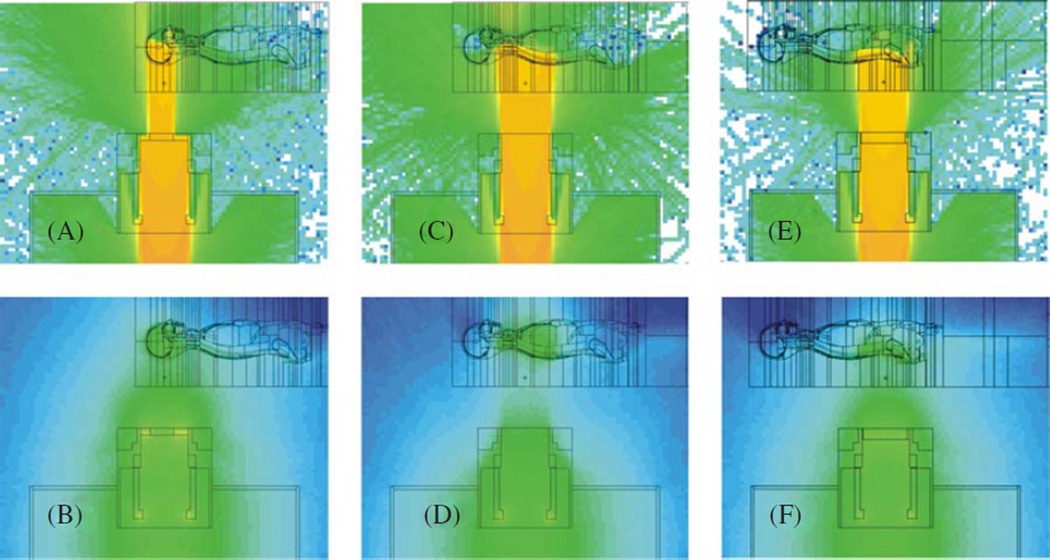
Monte Carlo simulation of particle fluences for the three craniospinal treatment fields. The upper plots represent the logarithm of the proton fluence, including primary protons and secondary protons generated via (n, xp) reactions in the treatment unit and in the phantom. The corresponding lower plots represent the logarithm of neutron fluence, including neutrons generated internally and externally to the phantom. Note that the fluence in each plot was scaled to maximize the visibility of the shape of the distributions, not their magnitude. (A), (B) Cranial field. (C), (D) Superior spinal field. (E), (F) Inferior spinal field.
(This figure is in colour only in the electronic version)

