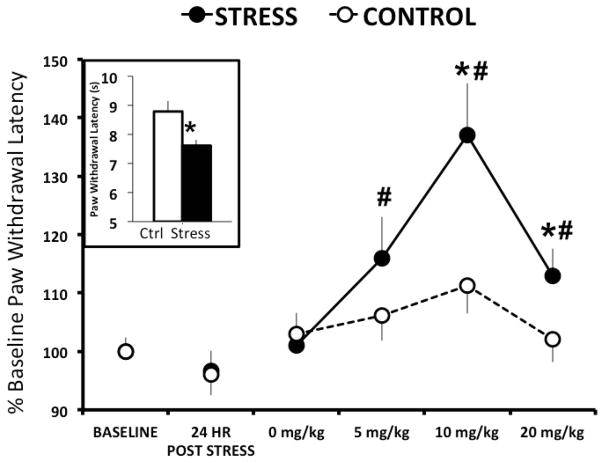
Figure 1. R121919 dose dependently increases paw withdrawal thresholds 2–5 days following predator odor stress.
Inset depicts mean ± SEM withdrawal latency of control (white; n=5) and predator odor stressed (black; n=16) rats 5 days following stress exposure. Line graph depicts mean ± SEM percent change from baseline paw withdrawal latency for predator odor stressed (solid circles; n=15) and control (open circles; n=16) rats 2–5 days following stress after four doses of systemic R121919. * denotes P<0.05 when stress compared to control. # denotes P<0.05 when dose is compared to vehicle.

