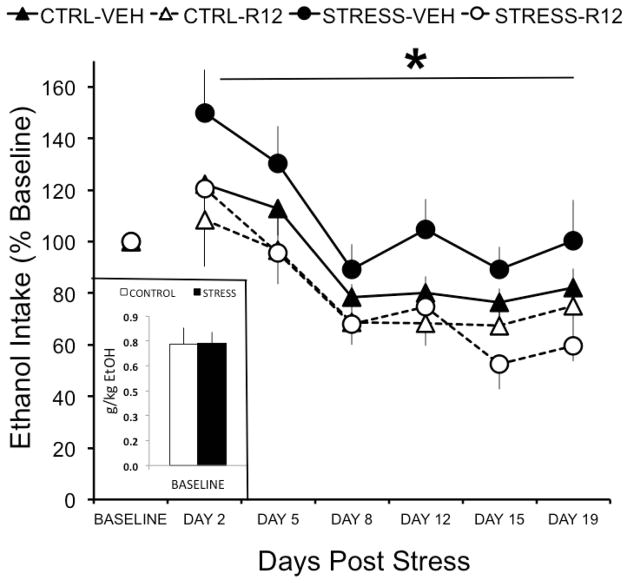
Figure 3. R121919 reduces alcohol self-administration following predator odor stress.
Inset depicts mean ± SEM baseline alcohol intake (g/kg) for predator odor stressed (black) and control (white) rats. Line graph depicts mean ± SEM percent change from baseline alcohol intake (g/kg) in predator odor exposed (circles) and control (triangles) rats chronically administered systemic R121919 (10 mg/kg; solid symbols; stress n=14, control n=7) or vehicle (open symbols; stress n=14, control n=6) on days 2, 5, 8, 12, 15, and 18 post stress. * denotes P<0.05 when drug is compare to vehicle in stressed animals.

