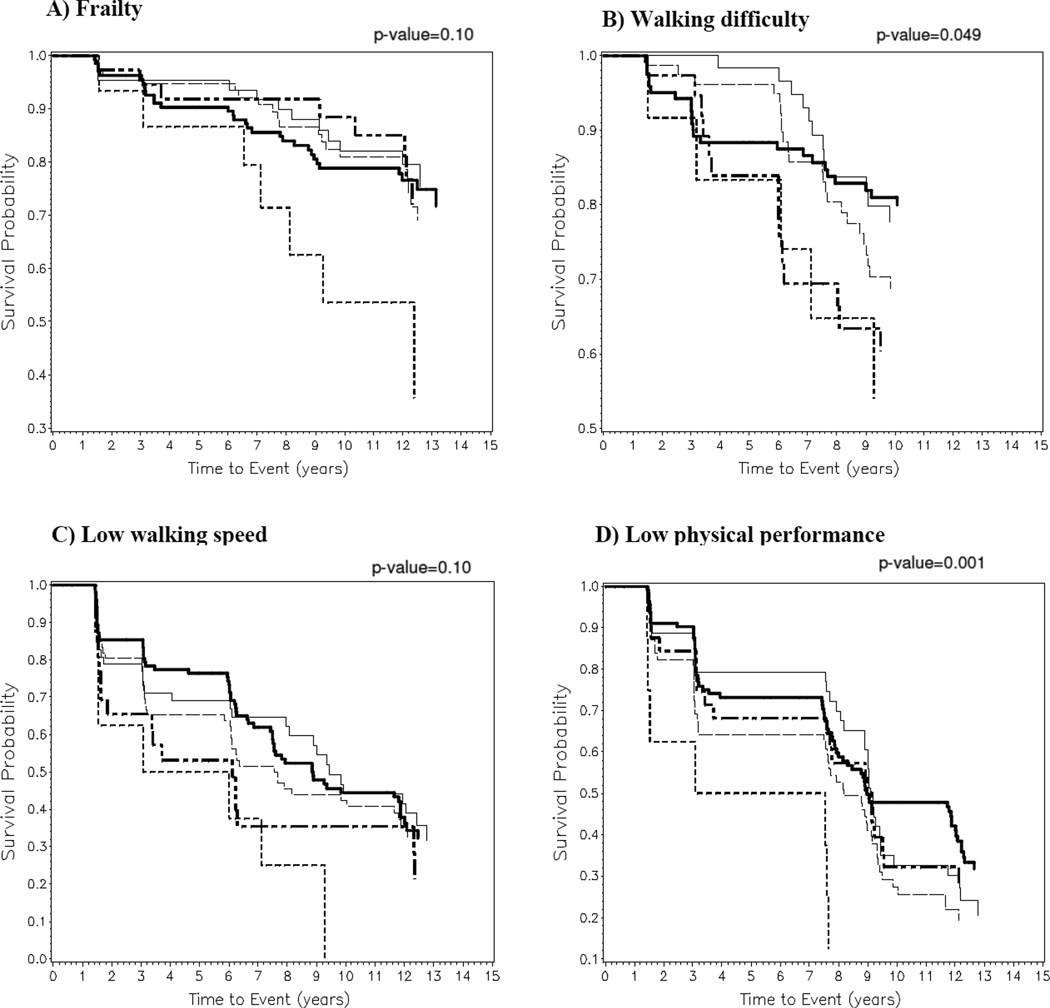
Figure 1. Kaplan-Meier Curves for Incident Frailty and Lower Extremity Mobility Limitations, by Category of Baseline Hemoglobin A1c.
Kaplan-Meier curves demonstrating the time-to-event of outcomes during follow-up for older women categorized by level of baseline hemoglobin A1c (HbA1c) including <5.5% (thin solid line  ), 5.5–5.9% (thick solid line
  ), 6.0–6.4% (thin dashed line
  ), 6.5–7.9% (thick short and long dashed line
  ), and ≥8% (thick short dashed line
  ). The association between HbA1c category and probability of survival for the outcomes are as follows: A) frailty (p=0.10); B) self-reported walking difficulty (p=0.049); C) low walking speed (p=0.10); and D) low physical performance battery score (p=0.001). The x-axis shows the time to event in years. The y-axis shows the probability of survival.

