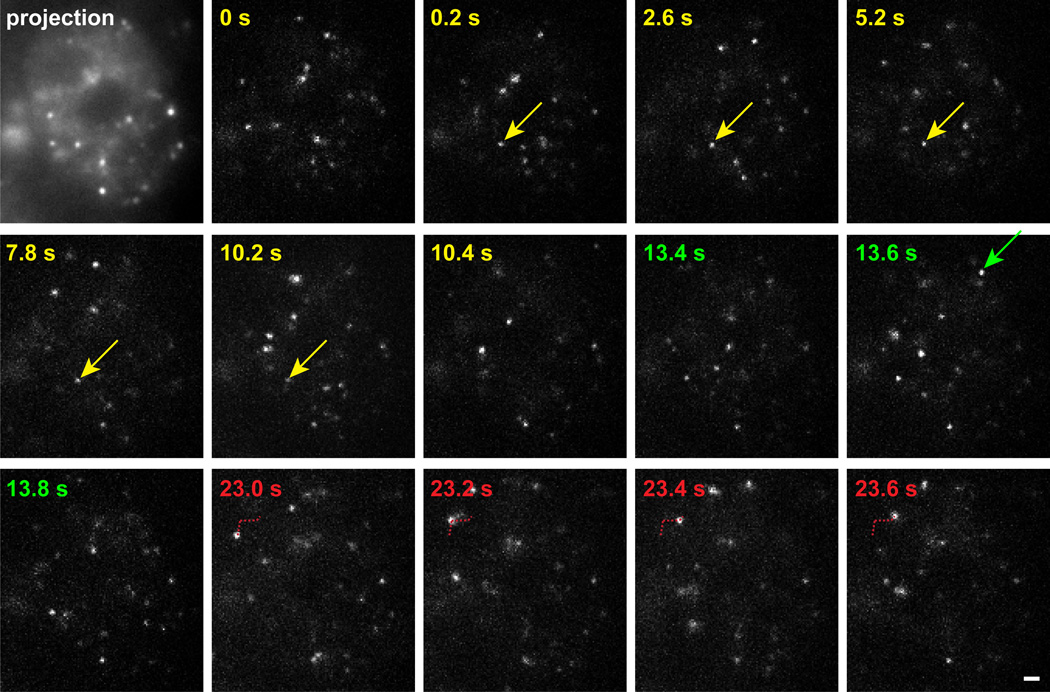
Figure 1.
Images of GR single molecules in the nucleus of a live cell. HaloTMR-tagged GR molecules at selected time points (upper left corner) are presented from a 60 s movie. Projection of 85 successive timepoints from the movie defines the boundary of the nucleus (first frame). Color coding in subsequent panels indicates three separate segments of the movie illustrating a bound molecule (yellow - residence time of 10 s), a molecule that appears for only one timepoint (green) and a free molecule that diffuses in the plane of focus (red). Arrows indicate the molecule of interest. Red dotted line indicates the path of the diffusing molecule. Scale bar 1 µm.

