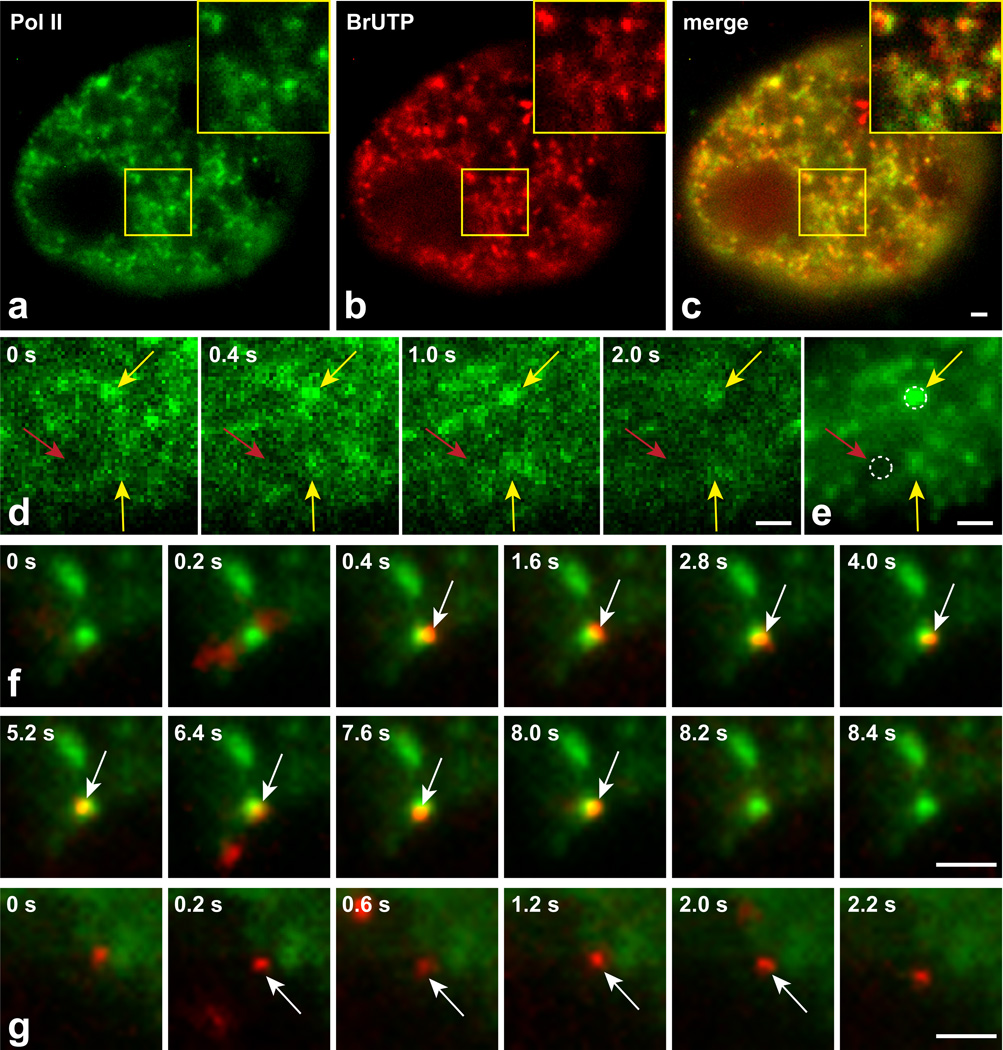
Figure 2.
Single molecule tracking within and outside of transcription domains. Fixed cells showing GFP-tagged polymerase II puncta (a) with BrUTP incorporation marking sites of transcription (b). Many polymerase II puncta are sites of BrUTP incorporation (overlay, c). Four time points (shown in upper left corner) of a GFP-polymerase II movie taken in live cells (d), and the projection image from that movie (e). Yellow arrows indicate examples of polymerase II foci that appear in multiple frames and give rise to well-defined domains in the averaged movie. Red arrow indicates a region largely devoid of polymerase. Dotted circles (0.6 µm diameter) provide examples of regions where single molecule tracking would be performed. (f) Selected time points from a movie showing association of a single GR molecule (red) with an averaged projection of a polymerase II movie (green). White arrows indicate the frames (0.4 s – 8.0 s) during which the GR molecule remains bound within the transcription domain. (g) Selected time points from a movie showing a bound GR molecule away from a transcription domain, with binding occurring from 0.2 – 2.0 s. Scale bars 1 µm.

