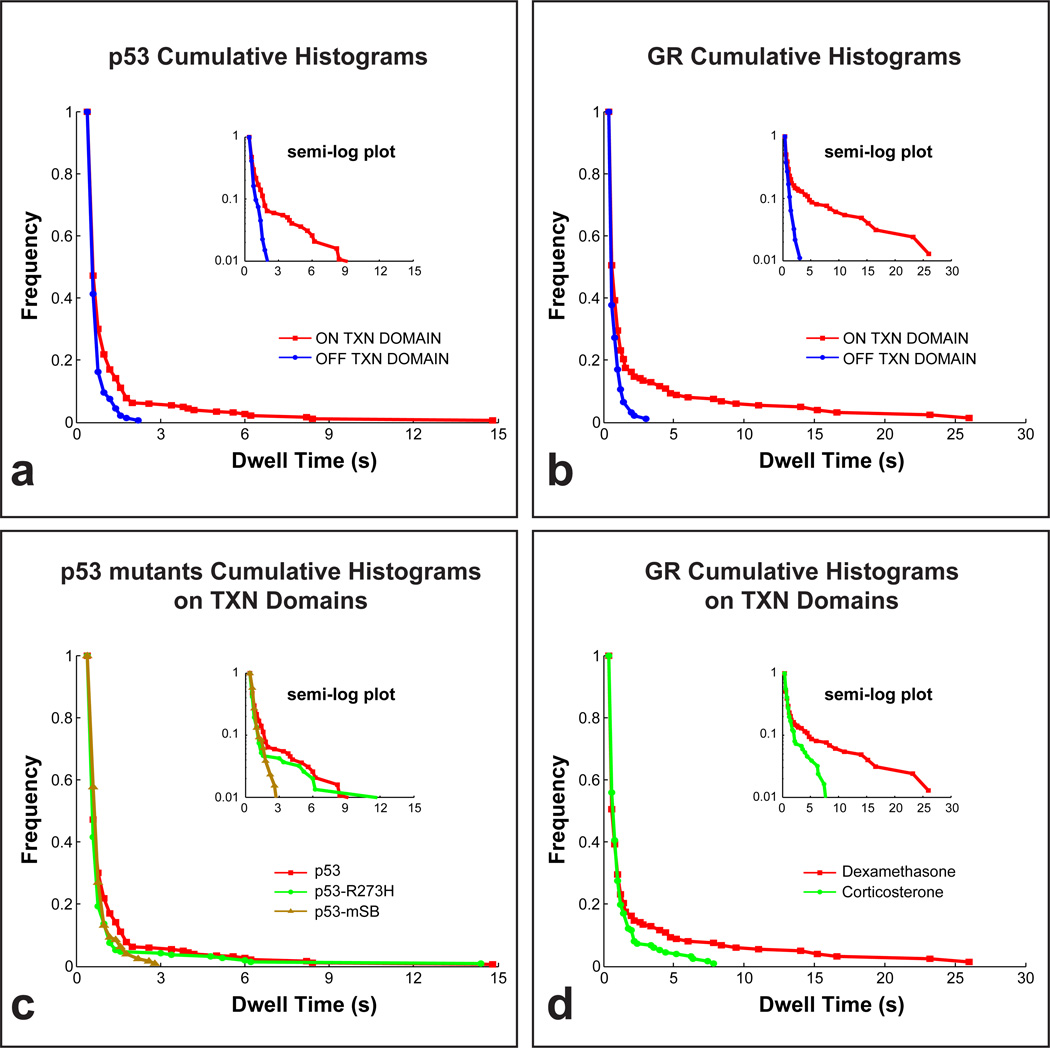
Figure 3.
Cumulative histograms with semi-log plots (insets). Dwell times of molecules in transcription domains are significantly longer than dwell times of molecules away from transcription domains for both p53 (a) and GR (b). The tail of the histogram for the seven-amino-acid specific-site binding mutant p53 mSB disappears, while a reduction in the height of the tail is seen for the single-amino-acid mutant p53 R273H (c).The tail of the historgram of GR activated with corticosterone fell to zero earlier compared to dexamethasone activation (d). We collected 20 – 30 time-lapse movies for each experimental condition. From this set of movies we selected 2 – 3 representative movies in which the number and brightness of the single molecules were optimal for tracking, and then from these movies we tracked a total of 400 – 700 single molecules for each condition. See Fig. S6 for histograms of p53 mSB, p53 R273H and GR outside of transcription domains, and Fig. S5 for representative fits to these data.

