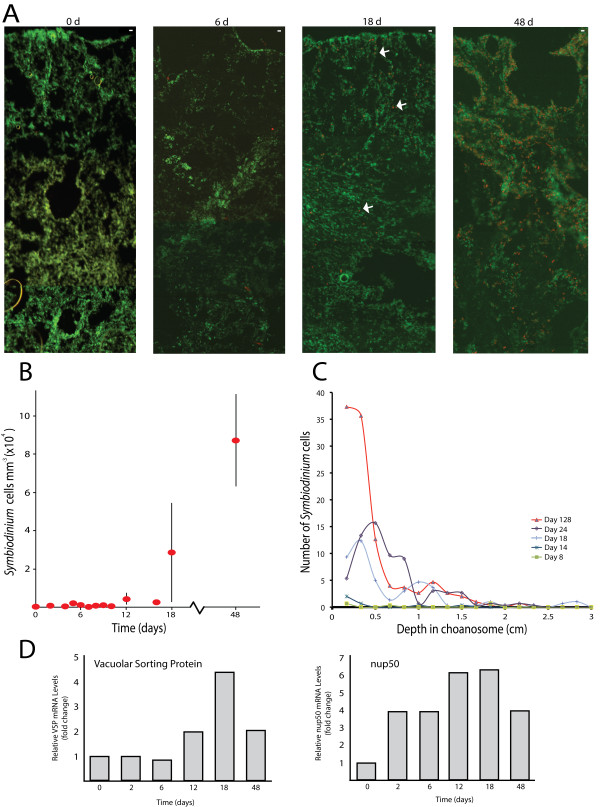
Figure 10.

Temporal dynamics of Symbiodinium reinfection of aposymbiotic Cliona varians tissue in under field conditions. A. Cryosections through sponge tissue starting at the pinacodermal (i.e., external) surface of the sponge down through the choanosome. Red/orange dots represent Symbiodinium cells. Scale bar (upper right corner of each figure) = 10 μm. B. Estimates of Symbiodinium density for the time points collected during the reinfection experiment. C. Density of Symbiodinium as a function of depth within the sponge tissue. D. Expression profiles for two genes (NUP50 and vacuolar sorting protein) as a function of time (and thus symbiont density). Y-axis represents the fold change in gene expression relative to time 0 with all points normalized to the housekeeping gene EF1α.
