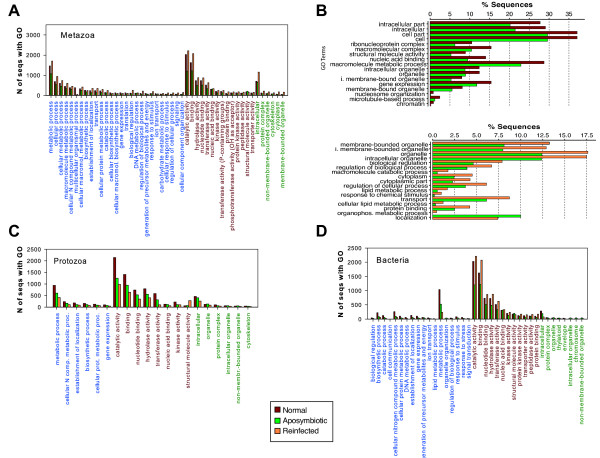
Figure 3.

Overview of GO term assignments in Cliona varians transcriptomes. A. Selected GO term assignments in each transcriptomic dataset (“normal”, “aposymbiotic”, and “reinfected” treatments) when searched against the database Metazoa. B. Enriched GO terms shown in pairwise comparisons between “normal” and “aposymbiotic” treatments, and “normal” and “reinfected” treatments using the correction FDR on the Fisher’s exact test (p > 0.005) for only metazoan hits. C-D. Selected GO term assignments in each transcriptomic dataset (“normal”, “aposymbiotic”, and “reinfected” treatments) when searched against the databases Bacteria, and Protozoa (sub-selections of the nr database from NCBI). In the x-axis of A, C-D, the GO terms belonging to the “biological process” category are shown in blue, those belonging to “molecular function” in red, and those to “cellular component” in green.
