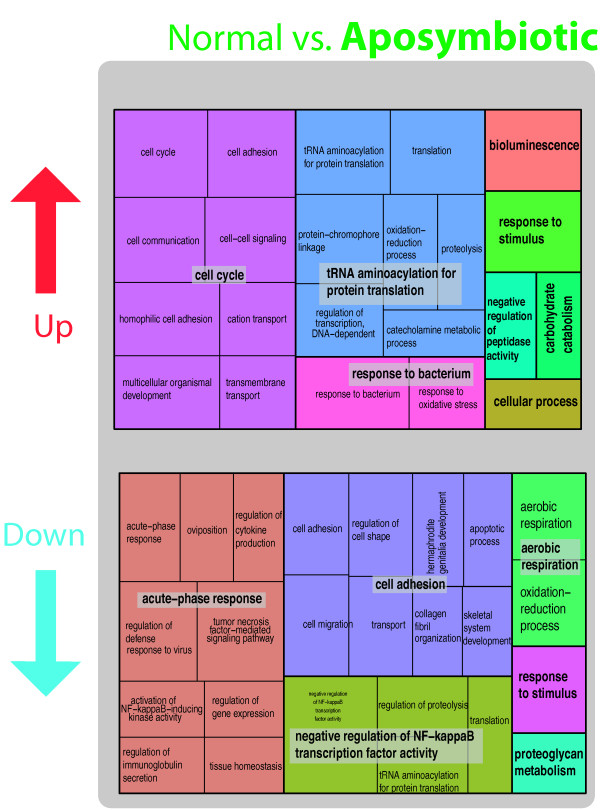
Figure 5.

Gene Ontology treemaps for the differentially expressed genes (both increased and decreased in expression) in the “aposymbiotic” treatment in the comparison “normal” vs. “aposymbiotic.” GO terms for genes expressed in “aposymbiotic” tissue are shown. The box size correlates to the –log10 p-value of the GO-term enrichment. Boxes with the same color can be grouped together and correspond to the same upper-hierarchy GO-term which is found in the middle of each box.
