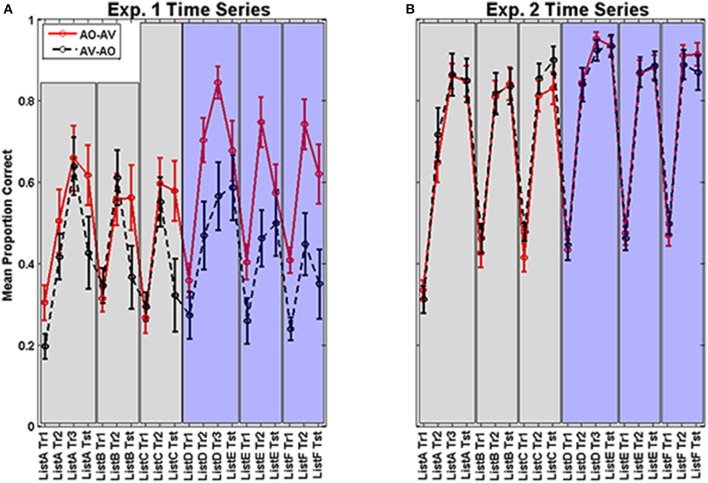
Figure 3.
(A,B) Experiment 1 (left A) and 2 (right B) time series. Means and standard errors of the mean for each training block and test block are shown across Period 1 (left half of each figure) and Period 2 (right half of each figure) for the AV-AO and AO-AV modality assignments. Lists were in a fixed assignment within each modality, so list designations in the figure (x-axis) represent the points in time for each training and test block. (Note: Tr, Training Block 1; and Tst, Test).

