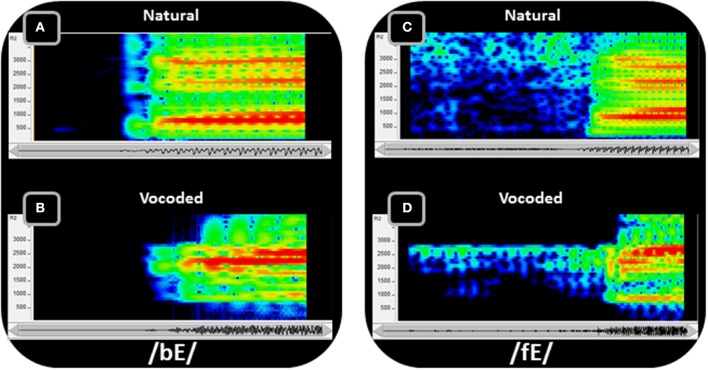
Figure 7.
Spectrograms of speech show the concentrations of energy in the spectra over time. Two speech tokens, /bE/ (A,B) and /fE/ (C,D) (i.e., the vowel in “bet”), are shown in spectrograms of the natural (A,C) recorded speech and the vocoded (B,D) speech. The frequency range of the spectrograms is limited to 4 kHz, because all of the energy from the vocoder is similarly limited. The amplitudes are represented as a heat map, with red the highest amplitude and dark blue the lowest. In addition to representing the speech as the sum of sinewaves at the center of each vocoder filter (see text), the vocoder also tilted the spectrum so that it did not roll off at approximately 6 dB/octave, which is natural to speech. Thus, the amplitudes of the frequencies vary between the natural and the vocoded speech, in addition to the frequency ranges and spectral detail (adapted from Bernstein et al., 2013).

