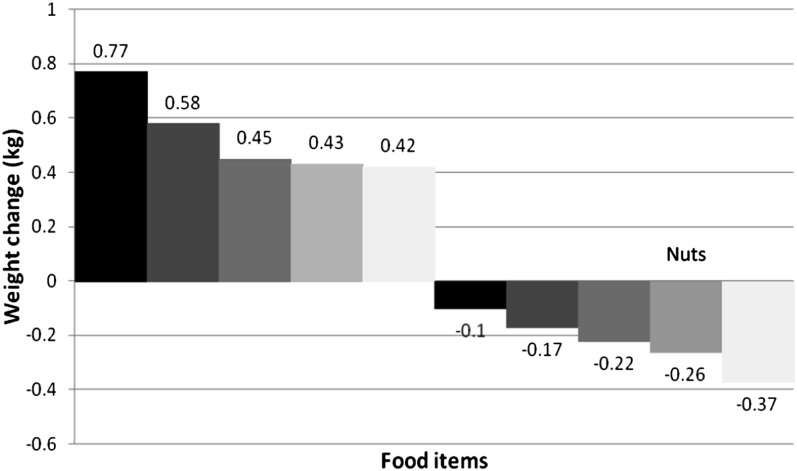
FIGURE 1.
Average weight change associated with a 1-serving increase for each food or beverage over 4 y. Data are from Nurses’ Health Study (NHS): 50,422 women followed for 20 y (1986–2006); NHS II: 47,898 women followed for 12 y (1991–2003); and Health Professionals Follow-Up Study: 22,557 men followed for 20 y (1986–2006). All weight changes were adjusted simultaneously for age, baseline BMI, sleep duration, and changes in smoking status, physical activity, television watching, alcohol use, the dietary factors shown as well as butter, sweets/desserts, refined grains, cheese, fruit juice, low-fat skim milk, and diet (zero-calorie) soda. Decreased intake of a specific food item would be associated with the inverse weight changes. P < 0.001 for all dietary factors shown in this figure. Multivariable linear regression with robust variance accounting for within-individual repeated measures was used for statistical analyses. Adapted from reference 16. Left side of panel: black column, potato chips; dark-gray column, potatoes or fries; medium-gray column, sugar-sweetened beverages; light-gray column, unprocessed red meats; white column, processed meats. Right side of panel: black column, vegetables; dark-gray column, whole grains; medium-gray column, fruit; light-gray column, nuts; white column, yogurt.

