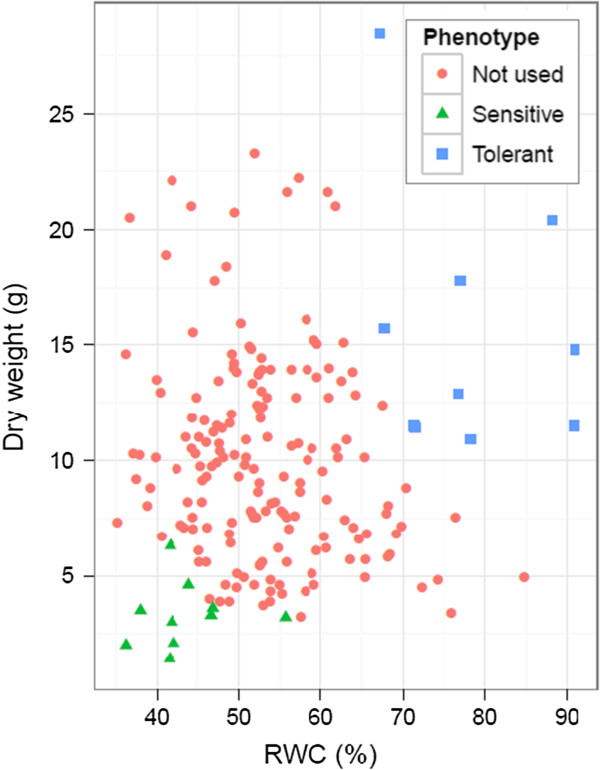
Figure 1.

Scatter plot of plant dry weight against relative water content (RWC) after drought stress. The ten drought tolerant genotypes are shown as blue squares and the ten sensitive genotypes as green triangles. The remaining genotypes from the mapping family are shown as red circles.
