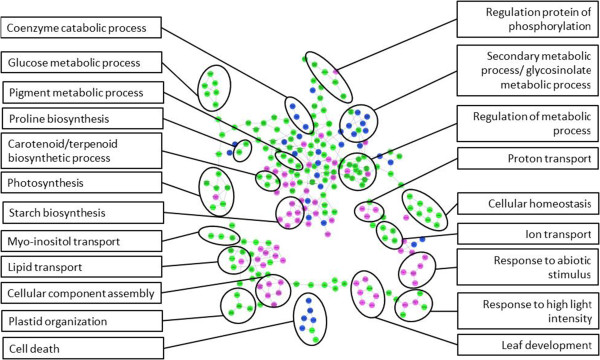
Figure 3.

Map of enriched GO after drought treatment in sensitive and tolerant phenotype pools. The map shows parent/child connections between GO terms. GO terms are coloured based on significance in two enrichment tests for tolerant and sensitive pools. Green: enriched in both pools, pink: enriched only in sensitive pools and blue: enriched only in tolerant pool. The GO map is annotated with black circles which are linked to summary GO terms, see text for discussion and GO terms.
