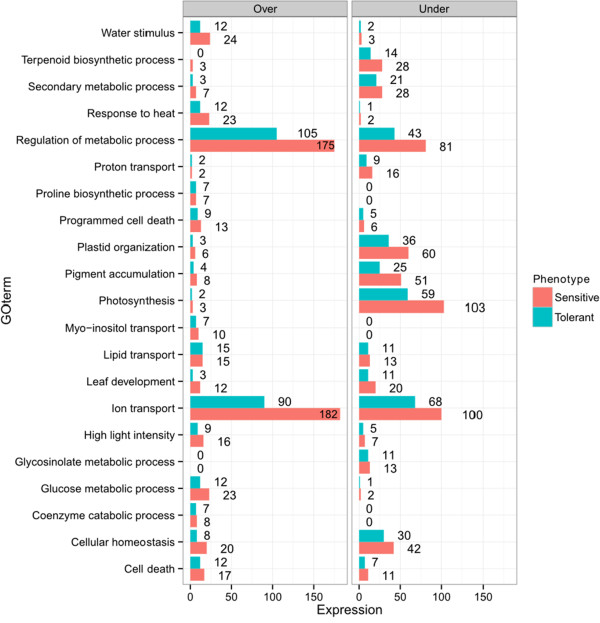
Figure 4.

Number of differentially expressed transcript tags after drought stress. The data show the number of transcript tags that are over and under-expressed in the tolerant and sensitive pools. The graph shows the GO term on the y-axis and number of differentially expressed transcript tags at the end of each bar, for each GO term.
