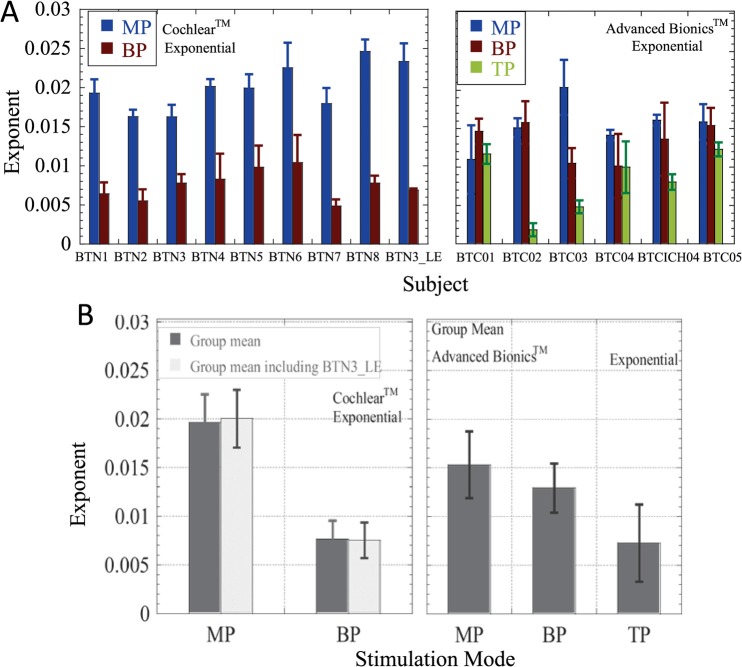
FIG. 4.
(Color online) (A) (Top). Individual subject's mean slopes (exponents derived from best-fitting exponential fits to the data), taken across the four electrode stimulation sites, for each mode. Left and right hand panels show results obtained with Cochlear CorporationTM and Advanced BionicsTM device users. Error bars show +/− one s.d. from the mean. (B) (Bottom). Group mean slopes for each mode, in Cochlear CorporationTM and Advanced BionicsTM users. Error bars show +/− one s.d. from the mean.

