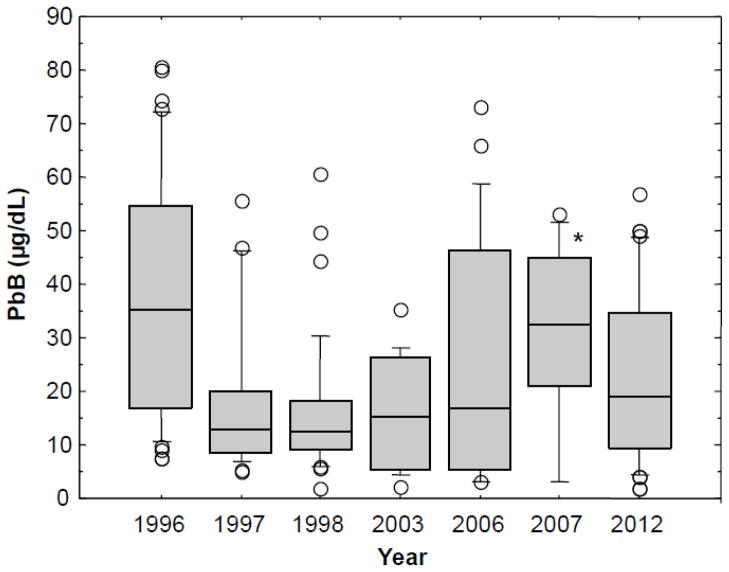
Figure 1.
Box plots showing blood lead (PbB) levels over time for the years 1996 (N = 41), 1997 (N = 25), 1998 (N = 32), 2003 (N = 14), 2006 (N = 23), 2007 (N = 10) and 2012 (N = 39) for cohorts of Andean Ecuadorian adults living in Pb-glazing communities. No PbB tests were performed in the intervening years not listed in the figure. The boxes contain individual PbB levels between the 25th and 75th percentiles. The horizontal lines inside the boxes represent the 50th percentile. The small horizontal lines above the boxes represent the 90th percentile, and the small horizontal lines below the boxes represent the 10th percentile. The individual data points represent cases above the 90th percentile and below the 10th percentile. *The interpretation of the box plot for the 2007 group should be made with caution because of the small number of participants (N =10).

