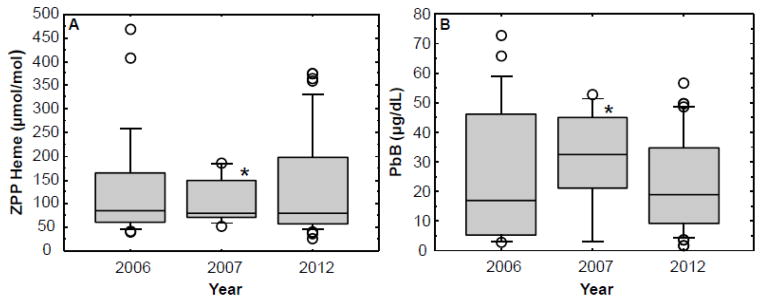
Figure 2.

Box plots comparing zinc protoporphyrin/heme ratios (ZPP) (A) and blood lead (PbB) levels (B) observed over three years (2006, 2007 and 2012) in adults living in Pb-glazing communities in the Andes Mountains of Ecuador. See Figure 1 legend for a description of the box plots. *The interpretation of the box plot for the 2007 group should be made with caution because of the small number of participants (N =10).
