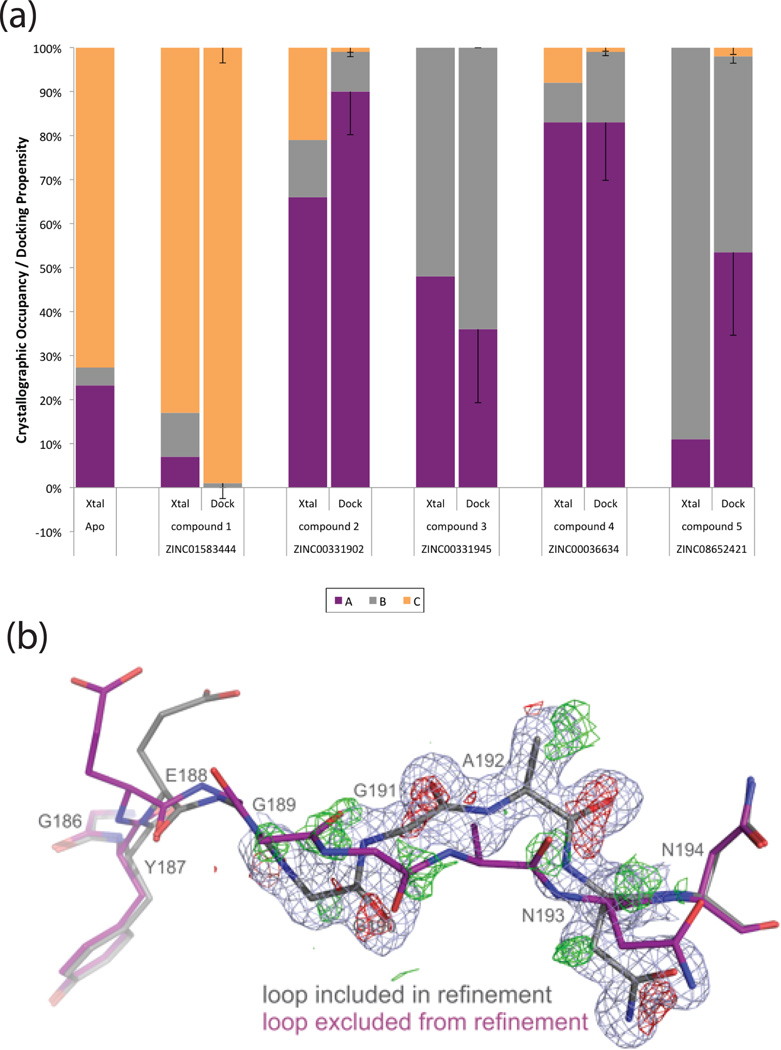
Figure 2. Predicting loop occupancies in holo-complexes.
(A) Experimental occupancies of three flexible loop (186–194) conformations A, B and C are depicted as a percentage (Xtal). These can then easily be compared to their predicted docking propensities (dock) for compounds 1–544. Using Boltzmann energy penalties and a multiplier m=2 results in close agreement of the major loop conformation between prediction (dock) and experiment (Xtal), with a Pearson Correlation Coefficient (PCC) of 0.83, and a p-value < 0.01. Error bars for docking propensities are derived by using any flexible weighting multiplier m between 1.0 and 3.0 and taking the standard deviation.
(B) The difference electron density map of CcP and compound 5 around the backbone carbonyls (red mesh for main loop in grey sticks and green for the new loop conformation) provides evidence for the presence of a second loop conformation (purple) even at very low levels around 10%. Resolution is 1.2 Å; 2mFo-DFc map rendered at 1σ and mFo-DFc map at 2.6σ.

